Analysis of flow cytometry data requires the identification of a homogenous cell population. This is achieved in a multistep process known as gating. It involves narrowing down the parameters that define the cell population of interest and excluding dead cells and cell debris from the analysis.
Getting Started: Know Thy Cells
A deep understanding of the biology of the cells under investigation is the necessary foundation for a well-designed experiment and a successful flow cytometry analysis. The parameters and unique identifiers of the cell population should be defined before starting the experiment. These include cell size, marker expression, and localization, as well as antigen density in healthy and diseased states.
Control the Things You Can Control
Controls are essential to distinguish data from background noise and artifacts. Here are some of the controls commonly used in flow cytometry analysis:
- FMO: a Fluorescence Minus One (FMO) control is a tube of cells stained with all fluorochromes used in the experiment except one.
- Viability dyes: to distinguish between live and dead cells.
- Isotype-specific controls identify non-specific antibody binding.
- Dump channel: used to exclude from the analysis all the cell subpopulations not of interest. For example, the dump channel can be used to identify and exclude dead cells.
Panel Design
Fluorophore selection is based on the spectral properties of the dyes (excitation and emission wavelengths) and their compatibility with the laser and filter settings of the instrument used for the analysis. To minimize spread, fluorophore brightness should be calibrated to the antigen density, and spectral overlay between different dyes should be evaluated. To simplify the process and minimize errors the use of a panel design tool like FluoroFinder’s is highly recommended, especially when working with large panels.
Data Collection
The number of cells that need to be collected in order for the analysis to be statistically significant depends on the sample, the relative abundance of the cell subpopulation, and the number of markers analyzed (PMID: 18307257).
Using the Time Gate to Identify Acquisition Problems
Small air bubbles, cell clumps, and air passing through the laser beams at the end of a sample run can all scatter and deflect fluorescent light in a way resembling a positive event. An effective way to identify these artifacts is to use the time gate: a plot of SSC ( side scatter) or FSC ( forward scatter) versus time. Spikes and gaps in the data indicate the presence of clogs or air bubbles. Gating should be restricted to unaffected regions where the signal is stable and uninterrupted. 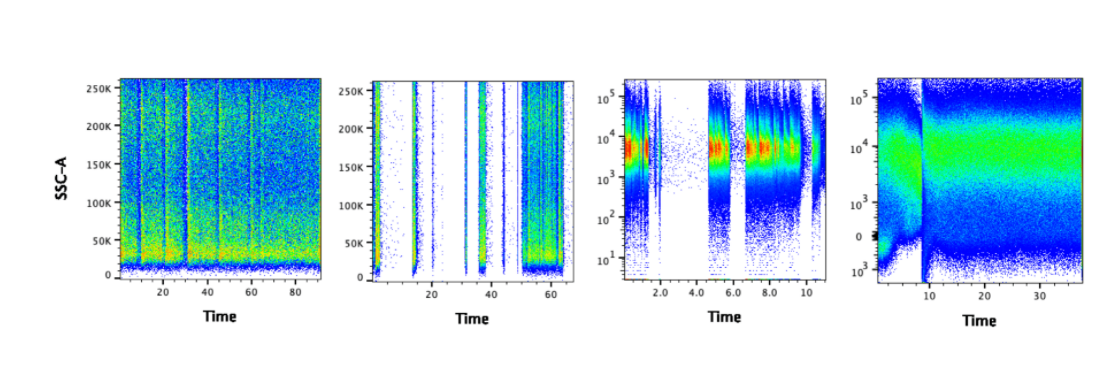 Figure 1. The gaps suggest there may have been clogs. It may be possible to salvage the data by gating on the portion of data where the signal is steady.
Drawing a “Loose” Gate Around your Cell Population
Forward (FSC) and side scatter (SSC) density plots are used to derive information about the size and complexity (granularity) of a cell population. Drawing a “loose” gate on the FSC or SSC plots helps to eliminate only those events that are not of interest, avoiding the loss of any information about the cell population under scrutiny. 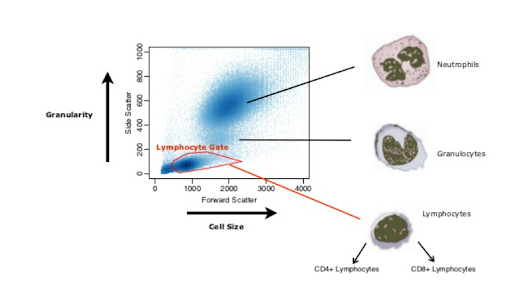 Figure 2: Distinguishing Lymphocytes from granulocytes and neutrophils, excluding cell debris. Nikolas Pontikos, 2012
Eliminating Cell Clumps and Doublets from the Analysis: Pulse Geometry Gating
Cells that are stuck together are one of the main sources of artifacts in flow cytometry. They can appear to be positive for an antigen that would normally not be expressed. A rapid way to detect and exclude cell clumps from the analysis is to plot the width or height of the pulse versus the area. Single cells typically fall along a diagonal, while the clumps of cells will display an increased area relative to the height.
Subset Gating
Uses specific markers to further isolate the cellular populations of interest and exclude dead cells from the analysis. Dead cells display an inherent ability to indistinctly bind any markers, making them a primary artifact-generating culprit. Using live/dead dyes will also help to distinguish dead cells. Live/deal cell dyes are amine-based molecules that can permeate the porous membrane of dead cells and bind to nucleic acids.
Backgating
It is often used when a new gating strategy is adopted to confirm the parameters of the cell population and ensure that no valuable information is lost in the previous steps.
Software Automation
Though manual gating is very popular among users of flow cytometry, there are some challenges associated with it. The most conspicuous is that a certain level of expertise is necessary to avoid common pitfalls. Furthermore, the method is subjective as there are many different gating strategies and, although general guidelines are available, there can be disagreement on the best way to apply gates. Manual gating can become very time-consuming, even daunting when high-content multi parameters screens are conducted. Software automation promises not only to overcome some of these limitations, offering a fast reliable, and reproducible way of analyzing samples, but also the opportunity to identify new cellular subpopulations. “Computational methods.. are able to detect trends within an entire flow cytometry dataset,… Hence, populations that were not specified in a given gating strategy may be identified by computational analysis” (PMID: 26284066).


