
Note: The flow dictionary is not alphabetical, but rather grouped by the logical order of a cell as it flows through a cytometer. If you are looking for a particular term, it may be easiest to use the ctrl+f search function.
Sections:
 Fluidics System
- Sheath Fluid The running solution that passes through a flow cytometer in laminar flow. Typical sheath fluids include buffered saline solutions (ie. PBS or HEPES) or water.
- Sample Injection Port The opening where the sample is pushed through the tubing to be introduced to the sheath fluid stream.
- Differential Pressure The difference between the sample injection pressure and the sheath fluid pressure is called differential pressure. This pressure differential controls the size of the core stream and the speed, frequency and total number of cells that pass the laser.
- Nozzle/Cuvette A narrowing of the sheath downstream of the injection port, where the fluid velocity is increased and the cell sample is focused into a single file stream due to hydrodynamic focusing.
- Interrogation Point The point at which cells flow in single file through the laser beam(s) for analysis.
 Optics & Detection
- Laser The light source for flow cytometry, lasers focus light at a set wavelength into a beam that can interact with sample cells or particles. Modern flow cytometers typically contain 1-5 lasers that allow for the analysis of multiple parameters.
- Forward Scatter After interacting with a cell or particle, light that is scattered in the forward direction is detected by the Forward Scatter Channel (FSC). FCS typically detects light offset forward up to 20° from the excitation beam’s axis, however, the angle can vary depending on the instrument. This measurement can help estimate the particle’s size, as larger particles typically refract more light than smaller particles.
- Side Scatter Light that is scattered 90° from the excitation beam is detected by the Side Scatter Channel (SSC). The SSC can provide information about the relative complexity, granularity or internal structures of a cell or particle.
- Photodiode A semiconductor device used to detect light and generate an electrical current. Typically used in forward scatter (FSC) detection.
- Photomultiplier Tube (PMT) A photodetector, with adjustable voltage, that translates optical tube signals into electrical current. PMT detectors are used for SSC. Increasing the PMT voltage increases the output signal for a given amount of light.
- Parameter A measurement of light intensity, either as scattered or emitted fluorescence, from a particle or cell as it passes through a laser beam. Channel Forward and side scattered light from fluorochromes and fluorescence from stained cells are split into defined wavelengths and channeled by a set of filters and mirrors within the flow cytometer. The fluorescent light is filtered so that each photomultiplying tube (PMT) sensor will detect fluorescence only at a specified wavelength, or channel. Filter An optical device inside a flow cytometer is used to channel particular light wavelengths.
- Band Pass Filter A filter that allows only a set range (band) of light wavelengths to pass through it, reflecting any light wavelengths outside of that set range. Bandpass filters are typically shown with the median wavelength followed by the total range of the band. For example, a bandpass filter of 630/20nm would pass light between 620nm and 640nm.
- Short Pass Filter A filter that allows any light below a set wavelength to pass through and reflects any light above the set wavelength.
- Long Pass Filter A filter that allows any light above a set wavelength to pass through and reflects any light below the set wavelength.
- Dichroic Filter A filter that blocks light by phased reflection allowing certain light to pass through while reflecting other wavelengths at a 90° angle. This allows the light to be passed through a series of ordered filters so that multiple signals can be detected simultaneously. Pulse The electronic signal generated by a particle or cell passing through the laser, recorded as an event in the flow cytometer.
- Event A unit of data representing one particle or cell. Each event has a relative intensity value and a channel number, which may then be plotted during data analysis.
- Singlet A single particle or cell, which a flow cytometer records as one event.
- Doublet Occurs when two cells or particles are stuck together, so the flow cytometer records them as a single event. Particles may also occur in triplets or even higher associations.
- Gain An adjustment that modifies amplifier responses. Increasing the gain increases the electronic pulse (and the relative fluorescence intensity value and the channel value) in response to a light signal.
- Threshold Setting A setting is used to eliminate unwanted signals detected from sources other than the particle of interest. For accurate results, the threshold must be set below the level where essential data is detected.
 Cell Gating
- Gating The process of setting boundaries to define subsets of events. Researchers set gates by drawing boundaries around subsets on histograms or dot data plots. Gates can be used for either data acquisition or analysis. Inclusive Gate A gate that selects only the events that fall within (or on) the boundary. Exclusive Gates A gate that selects only the events that fall outside of the boundary. Live Gate An acquisition gate that determines which events are recorded as data. Any data outside the gate does not enter the computer.
- Analysis Gate A gate used in analyzing the data. Any data that falls outside the analysis gate is recorded as events the computer’s memory, but are not included for analysis.
- Gate Set A collection of gates that limits data acquisition or analysis. Each parameter can only be used once in a gate set.
- Backgating A gating control to visualize the effects of each gate and ensure that the correct cell population has been identified.
 Data Analysis
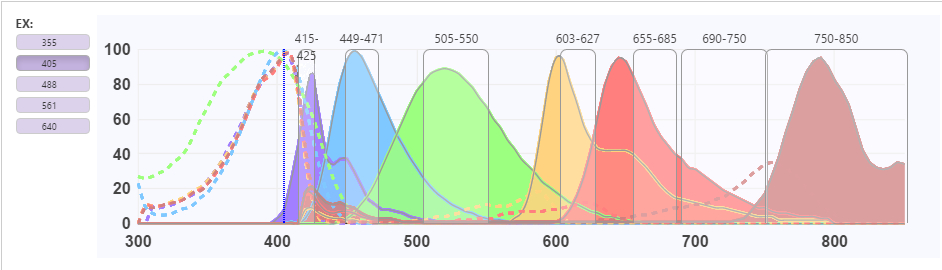
- Spectral Viewer Spectral viewers are used in flow cytometry to visualize the excitation and emission profiles of a given fluorochrome. The resulting spectral profile curve shows the fluorophore’s excitation and detection efficiency at any given wavelength. This information can be critical for effective panel design and selecting optimal fluorophores for a given instrument.
- Spectral Overlap (Spillover) For multicolor panels, researchers must consider complications from spectral overlap or spill-over from one fluorophore to the next. FluoroFinder’s unique SpectraViewer technology makes this easy by allowing researchers to compare multiple fluorochromes from different reagent suppliers simultaneously on a fully interactive spectral chart.
- Sample of a FluoroFinder SpectraViewer comparing reagents from BD Biosciences, Biolegend, Miltenyi Biotec, BioRad, Novus and Sony
- Compensation A mathematical algorithm for calculating and correcting for the spillover from a primary signal in each secondary channel that it is measured in. Determining correct compensation requires is critical for a successful flow cytometry experiment. Percent Coefficient of Variation (%CV) A measure of peak distribution where the standard deviation of the peak is divided by the mean channel number of the peak, expressed as a percentage value. This value is used for statistical analysis of flow cytometry data. Histogram Plot A single parameter (univariate) data graph that plots the intensity of expression versus the number of events. Most often used for cell cycle and proliferation analysis, histograms cannot demonstrate relationships between different markers and therefore cannot identify double-positive cells.
- Scatter Graph A two parameter (bivariate) data graph that plots the number of the experiments performed along with the average/spread of the data, and summarizes the data significance. Dot Plot A two-parameter (bivariate) data graph used for acquisition and analysis. Each dot on the display represents one event that the flow cytometer analyzed, so dot plots are useful for demonstrating expression levels.
- Density Plot A two parameter (bivariate) data graph used to show the relative number of events for a given region.
- Contour Plot A variation of the density plot where relative intensity of the data is shown using contour lines, where each line represents a set percentage of the population.
 Controls
- Fluorescence Minus One (FMO) Control A control used to determine proper gating of a multicolor panel. FMO controls contain all the fluorochromes in a panel, minus the one being measured. This allows you to assess the spread of all the fluorophores into the missing channel and set up gates accordingly.
- Isotype Control Isotype specific controls are useful to determine if an antibody in your panel shows non-specific binding affinity for your cells. While they can be used effectively to identify blocking issues in a variety of immunological assays, they do not replace proper gating controls (see Fluorescence Minus One). Antibody Titration The process of identifying the best concentration to use an antibody for a given assay. While the supplier may offer a suggested concentration range, it may be necessary to perform your own titration before running your assay.
 General Terms
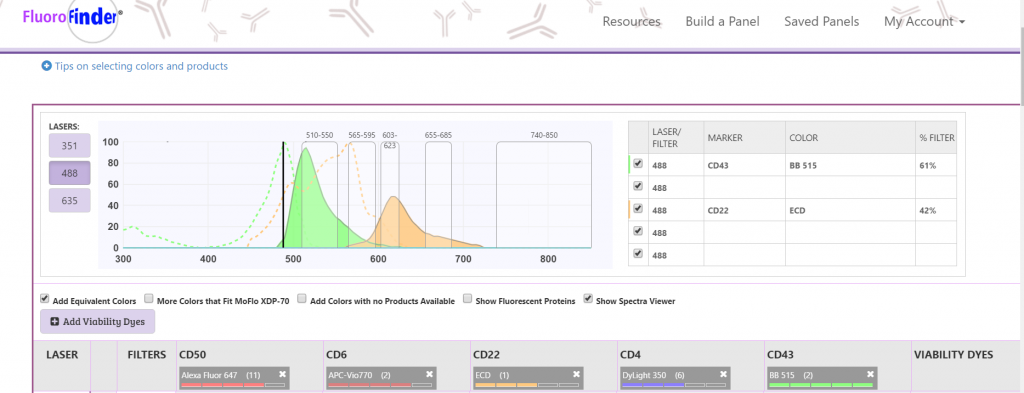
Antibody Panel The list of antibodies/fluorochromes that will be used for a given experiment. Typically laid out in a table with columns and rows corresponding to respective markers and channels. Panel Design Designing a multicolor flow cytometry panel requires researchers to piece together available antibodies/fluorochromes that will interact with the desired markers without causing excessive spillover across the available channels. FluoroFinder simplifies the panel design process by comparing antibodies from multiple suppliers and dynamically updating the available channels and reagents as you build your panel. Example of building a panel with FluoroFinder’s Panel Design Platform
Autofluorescence Naturally occurring cell fluorescence which can interfere with signal during flow cytometry analysis. Usually caused by cyclic ring compounds or aromatic amino acids, autofluorescence generally increases with cell size as larger cells contain more autofluorescent molecules. Fluorescent Activated Cell Sorting (FACS) A specialized type of flow cytometry whereby a heterogeneous population of cells can be separated into multiple subpopulations based on the specific light scattering or fluorescent characteristics of each cell. Initially developed by Len Herzenberg in 1976 (PMID: 1251180) and later trademarked by Becton Dickinson, FACS has proven invaluable for many types of cell sorting or analysis. FACS is now widely used in both research and clinical applications, especially for sorting blood, HIV, and cancer cell populations. Group Experiment Center FluoroFinder’s unique collaboration tool allows core facility managers, PI’s, or research teams to form groups to share their experiments, panel design ideas, reagent feedback, and more.


