
What is Spectral Spillover?
In flow cytometry, spectral spillover occurs when the emission of one fluorophore overlaps the optimal detection channel of a different fluorophore. Spillover is a concern in flow cytometry, as it can make fluorescent signatures difficult to resolve individually in a spectrally complex assay. We need to be confident that detecting a fluorescent signal translates to accurately detecting the antigen whose presence the fluorophore reports. In a multicolor assay, this requires the use of a mathematical correction factor to accurately resolve which fluorophore/marker combination is being accurately resolved as the multiplex level of the assay increases. In addition, there is an artifact in the detection of photons due to electronic noise in the detection system. Upon applying mathematical correction, this inherent error leads to a phenomenon we see in the distribution of populations in data called Spillover Spreading Error that can create challenges in the analysis of high parameter assays. There are many factors that contribute to spectral spillover, but our dependence on tandem fluorophores in flow cytometry is a significant contributing factor.
Flow cytometry relies on tandem fluorophores, where one molecule, the donor, is excited by the excitation source/laser and like an electronic circuit, transfers its energy to an acceptor molecule in a Förster Resonance Energy Transfer (FRET) relationship. This enables the simultaneous use of more fluorophores in an assay on an instrument with a limited number of lasers by creating a varied range of distinct emission peaks that would otherwise not be possible without employing tandem fluorophores. However, the more fluorophores that are employed to detect markers in an assay, the more additive spectral spillover that needs to be corrected, especially into the peak emission channel of the donor fluorophore that is shared between many tandems. Quality engineered tandem fluorophores will minimize spillover into the donor channel by attempting to optimize the number of acceptor fluorophores per donor and optimize the position of the acceptor to donor molecules bringing them as close in proximity as possible, to create a tandem with a highly quenched donor emission. A perfect tandem would have zero spillover into the donor channel; however, such a molecular pairing doesn’t yet exist.
There are other issues related to tandem fluorophores that impact spectral spillover including poor photostability and temperature or solvent stability. All of these can impact the ratio of emission of a tandem molecule into its primary, intended emission channel and the secondary, unintended emission into the donor channel. These issues can be caused by photobleaching of acceptor fluorophores in a tandem, increasing the ratio of photons emitted by the donor. It could also be due to the instability of protein-based fluorophores like PE and APC to temperature and different solvents. These issues, in particular, impact spectral detection, which relies upon an unchanging spectral profile of a fluorophore for accurate unmixing and subsequently accurate identification of which marker is expressed.
The width of the overall distribution of a fluorescence emission spectrum is directly related to the spectral spillover that will assault the emission detectors of its neighbors. This issue is not just with tandem fluorophores but non-tandem, simple organic dyes like Pacific Blue, FITC, or Alexa Fluor 647. The fluorophore whose emission spills into neighboring detection channels is often referred to as the assailant or culprit of the spillover. The same is true for the width of the distribution of the excitation profile of a fluorophore. It is common for a fluorophore to be excited, by other excitation wavelengths, even if it’s less efficiently. This is referred to as cross-beam spillover. A goal to engineer the perfect tandem fluorophore would be:
- High photostability and temperature and solvent stability
- Discrete excitation by only one laser employed on an instrument
- Highly efficient donor quenching (as close to 100% as possible)
- Staggering the emission of acceptor fluorophores so that tandems excited by different lasers do not all emit into the same emission ranges
- Employing acceptor fluorophores with minimal cross-beam excitation efficiency.
What is Spillover-Spreading Matrix?
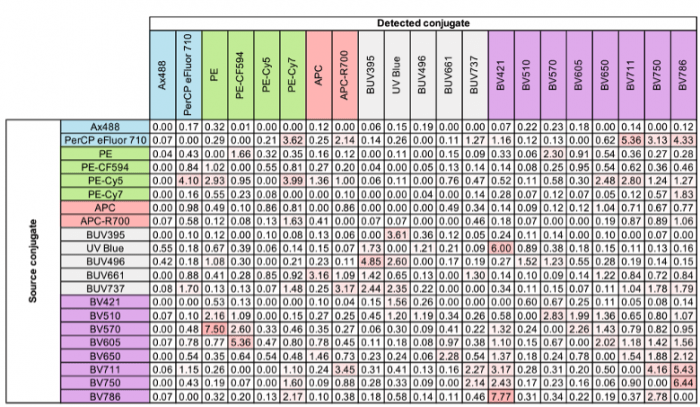
The spillover-spreading matrix (SSM), or spillover matrix, is a table of values that represents the degree to which a fluorophore spills into another detection channel on an instrument. This table is a component that mathematically estimates the degree to which that spillover will lead to the spreading error phenomenon. The values in the matrix represent a standard deviation of spillover, called signal spread, and are not on an absolute scale. For the best explanation and more information on the math used in this calculation, you can refer to the FlowJo website1 or the quintessential paper from Nguyen and Perfetto2 from 2013. Spillover spreading values can be used in the panel design process as a guide to which combinations of fluorophores are most compatible to report markers that will be co-expressed on the same event or cell and which combinations have dangerously high spectral spillover. Combinations of dyes with high spectral spillover should either be assigned to markers with no co-expression or avoided altogether. It’s important to understand that this matrix reflects the instrument specifications as much as reflects the spillover related to the physical properties of the fluorophore.
Here is an example from a conventionally compensated 20-color assay from OMIP-613. All of the spillover spreading values are below 10 due to the wavelength range of each of the detectors being very spectrally separated. On the other hand, in OMIP-694, which included 40 fluorescent markers in a single assay, multiple values were above 10. This threshold at 10 can be generally used as a loose rule to guide the assessment of overall risk of spectral complexity to the panel.
What is Compensation vs Unmixing?
As previously described, many researchers will choose to employ a mathematical correction factor that will account for the emissions of all unintended fluorophores into a detection channel. Compensation and unmixing do not fundamentally change the data – they simply correctly reassign a photon’s identity back to its origin fluorophore. In a very simple 4-color panel, you may not even need to employ compensation if the fluorophores have limited or no spectral spillover. However, since we rely on correctly identifying the fluorophore to accurately represent the antigen expression, we must correct for spectral spillover to resolve populations of data. Mathematical correction can come in two forms: traditional compensation or spectral unmixing. Compensation is simpler, as it only corrects for spectral spillover and does not take in to account other elements of noise in the detection system. There are many different strategies for unmixing algorithms, which attempt to account for sources of noise in the electronics of the detection system. The most employed unmixing algorithm that you can use for live unmixing during acquisition is the Least-Weighted Squares (LWS). The intricacies that make each of these strategies distinct is a conversation for another day; however, I do recommend publications authored by David Novo on this subject5.
What is Similarity Index vs Complexity Index?
Similarity and complexity indices are measures of how similarly spectral signatures match or overlay each other. The similarity matrix, like the spillover spreading error matrix, is arrayed as a table on each fluor matched to another fluorophore used in the panel. For example, if the assay includes ten fluorophores, the similarity matrix with be a 10×10 table of each fluorophore matched with the others. The value does not reflect spreading error, only how similarly the spectral signatures of each fluor match one another.
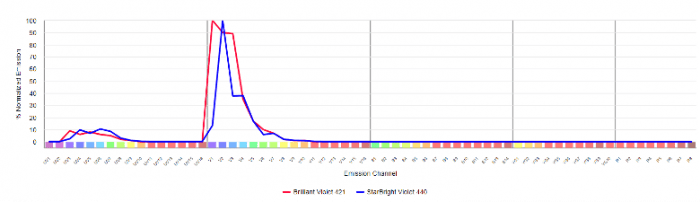
Within FluoroFinder’s Spectra Viewer, users can visualize the similarity matrix for their panel. For example, if we are considering using Brilliant Violet 421 and StarBright Violet 440 on different markers within a single panel, I can select these fluorophores to display the spillover matrix. 1.0 indicates 100% similarity, so the similarity index score of 0.8 indicates that Brilliant Violet 421 is 80% spectrally similar to StarBright Violet 440. Thus, I would not want to dedicate these fluors to markers within the same co-expression group or cell subset. However, if this fluorophore combination is necessary, with proper panel optimization testing, these two fluors may be different enough to dedicate them to different makers in the same assay that are no co-expressed or where one fluorophore is dedicated to the dump channel, which will be excluded from the analysis.
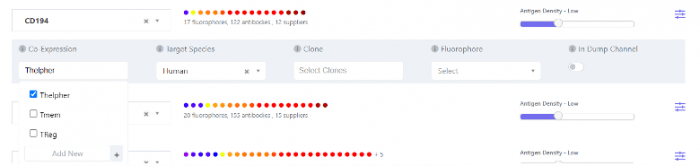
On the other hand, the complexity matrix relates to a culmination of all the similarity index values and assesses the similarity of the spectral signatures of all the fluorophores within a single panel or within co-expression groups. With access to FluoroFinder’s IntelliPanel, users can assign each marker to one or more co-expression groups. In this example, in a list of 15 markers, there is a dump channel and three distinct subpopulations of cells in which each of these markers is either positive or negative, “Thelper”, “Treg” and “Tmem”. The best rule of thumb is to include a marker in a co-expression group if the subpopulation will be displayed on the same analysis plot. For example, CD194, CD196, IFN-g, and IL-4 are generally used to define T-helper 1 (Th1) and T-helper 2 (Th2) cells. Even though some of these markers are positive or negative on Th1 or Th2 respectively, in analysis, they will still be displayed on the same plot, even if it is as a CD194-/CD196- population in the case of Th1 cells. The spillover spreading error still needs to be anticipated, even in a negative population.
The complexity index is also not on an absolute scale like the similarity index. As the number of parameters increases, so does the complexity index. In addition, on instruments without many UV or 405nm laser detectors, the complexity scores will be higher. Think of it as a value that indicates whether changes you make are creating more or less spectral complexity in the panel. It is important to consider the complexity index value that is assigned to the specific co-expression groups within FluoroFinder’s Panel Builders. Total panel complexity index scores do not account for important information like co-expression. This is an important component of panel optimization and reagent assignment to specific markers. Here is an example from a 15-color panel on an 18-color BD Fortessa (2UV/7V/2B/3YG/3R):

As the number of distinguishable fluorescent parameters increases, it’s important to provide tools that guide panel design. Most people do not memorize spectral profiles, so understanding what spillover is, how it changes, and the different index tools provided to assess the impact spillover will have on our panels is important in helping us build the best panels the first time!
Supporting Your Research
FluoroFinder’s tools like the Spectra Viewer and Panel Builder with IntelliPanel, help you visualize spillover, assess spectral complexity, and make informed decisions when selecting fluorophores. With access to similarity and complexity matrices, as well as advanced panel-building features, you can minimize spectral spillover and maximize assay performance. Whether you’re designing a simple panel or tackling high-parameter experiments, FluoroFinder provides the insights and resources you need to streamline your workflow and achieve reliable, reproducible results.
References
- https://docs.flowjo.com/flowjo/experiment-based-platforms/plat-comp-overview/spillover-spreading-matrix/
- Nguyen R, Perfetto S, Mahnke YD, Chattopadhyay P, Roederer M. Quantifying spillover spreading for comparing instrument performance and aiding in multicolor panel design. Cytometry A. 2013;83(3):306-315. doi:10.1002/cyto.a.22251
- DiPiazza AT, Hill JP, Graham BS, Ruckwardt TJ. OMIP-061: 20-Color Flow Cytometry Panel for High-Dimensional Characterization of Murine Antigen-Presenting Cells. Cytometry A. 2019;95(12):1226-1230. doi:10.1002/cyto.a.23880
- Park LM, Lannigan J, Jaimes MC. OMIP-069: Forty-Color Full Spectrum Flow Cytometry Panel for Deep Immunophenotyping of Major Cell Subsets in Human Peripheral Blood. Cytometry A. 2020;97(10):1044-1051. doi:10.1002/cyto.a.24213
- Novo D. A comparison of spectral unmixing to conventional compensation for the calculation of fluorochrome abundances from flow cytometric data. Cytometry A. 2022;101(11):885-891. doi:10.1002/cyto.a.24669


