Spectral cytometry offers increased flexibility for fluorophore selection but researchers should still apply best practices for panel design.
It has been almost 20 years since spectral cytometry was first described by the Robinson group at Purdue University Cytometry Laboratories. Since then, the technology has become synonymous with highly multiparametric single-cell analysis, enabling simultaneous measurement of 40 or more markers with high resolution. While spectral cytometry offers more flexibility than conventional flow cytometry with fluorophore selection, careful consideration is required for panel design. Here, Cytek® Biosciences and BioLegend explain the underlying principles of spectral cytometry and share tips for designing multiparametric panels.
Principles of Spectral Flow Cytometry
Spectral cytometry introduced fundamental optical and mathematical changes to conventional flow cytometry. This approach enables researchers to detect more markers per sample. “The main difference between conventional flow cytometry and spectral flow cytometry lies in how the fluorescent signals are detected,” reports Maria C. Jaimes, VP of Scientific Commercialization at Cytek® Biosciences. “While conventional flow cytometers detect only the peak of light emission for each fluorophore included in an assay, spectral cytometers collect the majority of the emitted light. In practical terms, this means that spectral cytometry allows for the use of spectrally overlapping dyes and can also treat autofluorescence (AF) in the same way as if it were another fluorophore in the panel. Being able to address AF like this allows researchers to better resolve the signals coming from the actual fluorophores, which may be obscured by sample AF, or to use AF as a separate parameter for cell characterization.”
Another distinction between conventional and spectral flow cytometry is the algorithms used to separate signals from fluorophores. “Conventional flow cytometry addresses spectral overlap by applying compensation,” reports Safa Moreno, Associate Product Manager for Cell Analysis and Flow Cytometry at BioLegend (now part of Revvity, Inc.). “This is essentially a correction factor to determine how much of the signal detected in a specific channel originates from the fluorophore of interest and how much of that signal comes from other fluorophores in the same panel. Spectral cytometry instead uses unmixing, which can be thought of as a more intricate form of compensation based on the unique spectral signature of each fluorophore.”
Jaimes explains that in a conventional cytometer, each fluorophore is assigned to an individual detector (a 1:1 ratio). In a spectral cytometer, the signal for each fluorophore is processed by all of the detectors in the system. “If you consider an 8-color assay as an example, an 8 x 8 matrix will be generated for compensation in a conventional cytometer, while a matrix consisting of 8 x the number of detectors will be generated in a spectral cytometer,” she says.
Reagent Selection
The introduction of spectral flow cytometers has created opportunities to develop new fluorophores. BioLegend is actively innovating in this area with fluorophores exhibiting distinctive spectral properties. “We designed our Fire and Spark Dyes to give researchers a broader range of options for panel design,” notes Moreno. “Our Fire Dyes are tandem fluorophores that expand into spectral spaces previously unused in conventional cytometry, and include products with enhanced stability and brightness properties for existing channels. Our Spark Dyes are small, synthetic fluorophores that offer multiple advantages for scientific research. These include relatively narrow emission profiles, high stability and solubility, and compatibility with most standard fixatives, including the harsh organic solvents that are often used when detecting phosphoproteins.”
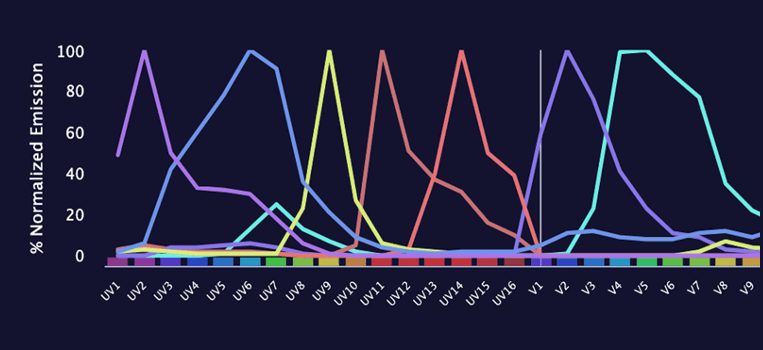
Jaimes highlights the increased importance of having a broader selection of fluorophores. This expanded range is crucial for carefully selecting the most compatible fluorophores for specific assays and identifying compatible combinations when creating complex multiparametric panels. It has become a vital initial step in the panel design process. “To ensure users could access the full spectrum signatures of the most commonly used dyes, Cytek® Biosciences created fluorophore guidelines as well as a full spectrum viewer,” says Jaimes. “In addition, we developed a metric called the Similarity Index (SI)™ in response to a frequently asked question following the launch of the Cytek® Aurora spectral cytometer – namely how different the spectra must be between two dyes to allow for their use in combination in a highly multiparametric panel. The SI ranges from 0, meaning that the two signatures are 100% different, to 1, meaning that the two signatures are identical. After extensive testing, it was determined that dyes with an SI as high as 0.98 could be combined.”
The SI metric is now routinely used for fluorophore selection, where it can be applied for a variety of purposes. These include designing low complexity panels, where the SI allows for identification of the most distinct fluorophores to ensure little or no spillover spread, and establishing all possible dyes that can be used in combination (including dyes with an SI as high as 0.98), where the SI serves to increase the number of parameters being measured by a given panel.
Tips for Panel Design
When designing a multicolor panel for spectral flow cytometry, researchers should apply the same practices recommended for conventional flow cytometry. “Researchers should always find out as much as possible about the biological system being investigated before assigning antibodies and fluorophores to markers,” advises Moreno. “Factors to consider include the number of markers needed to definitively identify each cell type, how abundant those markers are, and where they are expressed on the cell.”
Jaimes adds that it is critical to also consider co-expression. “Co-expressed markers should be assigned to fluorophores that introduce the least amount of spread, especially when the antigens in question are highly expressed,” she says. “Spillover spread is a constant in both conventional and spectral flow cytometry since fluorophores emit across a range of wavelengths and the probability of one fluorophore’s range overlapping with that of another is very high. The overlap generates spread in the negative signals, thus decreasing the resolution, and can be especially problematic when designing highly multiparametric panels.”
Although spread will always be present, there are ways to minimize its impact. “Because spectral cytometry allows users to visualize the full spectrum for each fluorophore, it allows for easy identification of common emission areas between dyes,” says Jaimes. “To further simplify the process of addressing spread, manufacturers like Cytek® Biosciences provide examples of matrices that quantify the spread introduced in typical dye combinations.” However, she cautions users to measure the spread for their chosen fluorophores during panel design and to assign dyes introducing high spread into each other to antigens that are not co-expressed. “If this is not possible, another option is to assign a fluorophore introducing high spread into another fluorophore to a low expressed antigen. That way the spread is minimized, she says.”
In recent years, there has been a significant number of publications using spectral cytometers. OMIP papers describe in detail the steps taken for panel design and optimization as part of the supplementary materials. OMIP-069 is a great example of this kind of publication and has been successfully used by researchers worldwide to guide the development of their panels for spectral cytometers.
Supporting Your Research
Designing a spectral panel is now easier than ever with FluoroFinder’s Panel Builder and Spectra Viewer now supporting full spectrum technology. In addition, our partners have developed an extensive selection of spectral cytometry resources, including Cytek® Biosciences’ SpectroLearn portal and BioLegend’s dedicated websites for Spectral Cytometry and Fluorophore Families.
Sign up for our eNewsletter to receive regular updates about spectral cytometry and other fluorescence-based techniques, including the very latest product offerings from our partners.


