The recent publication of a 43 color panel for the characterization of Peripheral Blood Mononuclear Cells (PBMC) is yet another example of the multiplexing potential of spectral flow cytometry. The technology, first demonstrated by Dr. Paul Robinson at Purdue University in 2004, captures the full emission spectrum of fluorophores enabling high-throughput detection of over 40 colors from individual cells. Besides increased flexibility in panel design, spectral flow cytometry advantages include higher sensitivity and improved resolution and limit of detection compared to conventional flow cytometry.
The technological innovations that made it possible
Enhanced optics
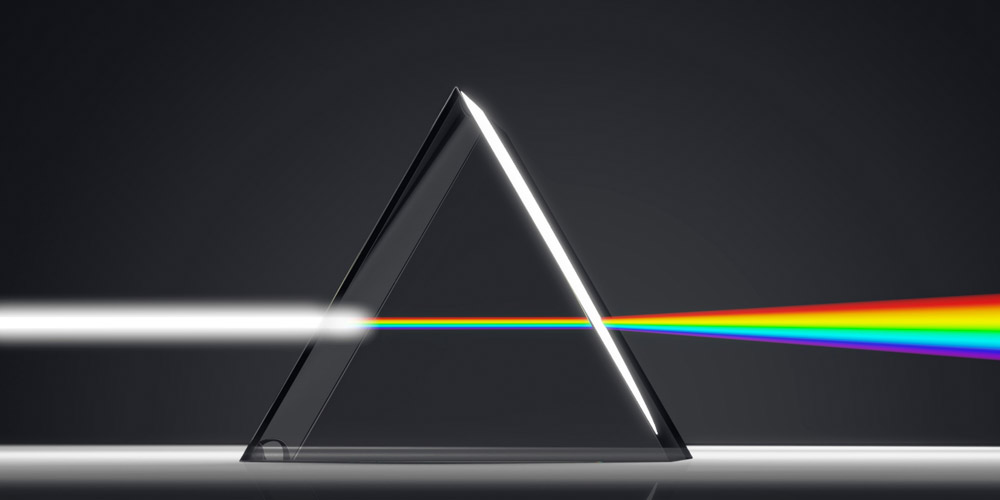
Conventional flow cytometry relies on bandpass filters and dichroic mirrors to isolate a narrow wavelength band around the emission peak of each fluorophore so that each detector is dedicated to collecting photons emitted from one color. Spectral flow cytometers, instead, use dispersive optics, such as prisms or gratings, that scatter photons according to wavelength across an array of detectors. By capturing the entire visible and near-infrared spectrum of each fluorophore, spectral flow cytometry can distinguish fluorophores with very similar emission wavelengths as long as they have distinct signatures across the spectrum.
Improved detectors
Conventional flow cytometry uses photomultiplier tubes (PMTs) to measure fluorescence in specific wavelength bands. PMTs have lower quantum efficiencies in the red and far-red regions, thus effectively limiting the use of fluorescent molecules that emit in these regions. When designing large multicolor panels, it becomes imperative to be able to include these dyes in the analysis. Furthermore, PMTs increase the footprint and the cost of a cytometer. The detectors of choice for spectral flow cytometry are multianode PMTs or charged coupled devices (CCDs). CCDs are compact and can provide sub-nanometer spectral resolution as well as very high quantum efficiencies (>95%) across the visible spectrum. Multianode PMTs have lower quantum efficiency and resolution than CCDs, especially in the red regions, but have much higher gain and faster speed . The increased efficiency and the smaller size of the newer detectors make it possible to build an array of detectors that can capture the entire spectrum of the fluorophore, increasing sensitivity and resolution.
Spectral analysis and spectral unmixing
The deconvolution of the spectral profile to distinguish the contribution of the different fluorophores is known as spectral unmixing. One of the most commonly used unmixing algorithms is the classical least squares (CLS) method. It is a supervised approach, used when the spectrum of the individual components is known. The Multivariate Curve Resolution algorithm is instead an unsupervised method, used when nothing is known about the individual spectral components.
Consideration for experimental design
General considerations for the design of multicolor flow cytometry experiments apply also to spectral flow cytometry. For example, understanding the biology of the cell population under investigation, including marker expression, antigen density, and the cell activation state, is essential to design a successful flow cytometry experiment. Fluorophore brightness should be selected based on antigen expression levels. Additional considerations need to be applied to spectral flow cytometry including appropriate calibration and control samples. When designing a complex panel, FluoroFinder’s panel builder can help avoid costly and time-consuming mistakes. The spectral panel design functionality is optimized to eliminate many constraints limiting conventional panel design to unleash the full potential of spectral analysis. Researchers can easily display and compare fluorophores’ full spectral profiles and rely on similarity scores and fluorophore recommendations to choose the best fluorophore combinations for your experiment. Fluororfinder’s panel builder supports panel design for all commercially available spectral analyzers. Instrument configurations for Cytek Aurora and Northern Lights, Sony ID7000, SA3800, SP6800 and, Thermo Fisher Bigfoot are currently pre-loaded and can be selected at the beginning of panel design workflow so that instrument-compatible products are chosen. Furthermore, access to millions of antibodies from all suppliers to compare product reviews and pricing enables researchers to design the best panel with the most validated products, ultimately saving considerable time and money.
Challenges of spectral Flow Cytometry
Fluorochromes
The limited number of dyes with unique spectral signatures presents a challenge when designing spectral panels. Reagent manufacturers have reacted quickly to meet the challenge by taking advantage of the relative ease with which small variations in the chemistry of existing dyes can generate new fluorochromes with distinct spectral profiles. An increasing number of new dyes with emission profiles suitable for spectral unmixing are being released, allowing investigators to measure a growing number of proteins from a single cell.
Data analysis and interpretation
Spectral Flow Cytometry analysis generates large datasets. Data can be stored as discrete parameters in an FCS format data file compatible with conventional FC analysis software. However, storing and analyzing data as spectra takes full advantage of the large number of spectral data points generated during spectral FC data collection. Several analysis programs have been developed specifically to address this limitation of FCS file formats. For example, De Novo has developed software that can read the raw spectral data along with the unmixed FCS files. Virtual bandpass can, thus, be applied and the spectra of cells can be visualized in different configurations, including as spectra of an individual or average cells or as a cell subpopulation gated based on the same parameters used for conventional FC gating.
Reproducibility
Increasing the number of parameters analyzed in the same sample inevitably magnifies the complexity of the experiment introducing variables that make experimental reproducibility very challenging. This problem is partly being addressed through the introduction of OMIPS and validated assay protocols.
References
- Sahir F, Mateo JM, Steinhoff M, Siveen KS. Development of a 43 color panel for the characterization of conventional and unconventional T-cell subsets, B cells, NK cells, monocytes, dendritic cells, and innate lymphoid cells using spectral flow cytometry. Cytometry A. 2020 https://doi.org/10.1002/cyto.a.24288
- Robinson, J. P. (2019). Spectral flow cytometry- Quo vadimus? Cytom. A. 95 (8), 823–824. doi:10.1002/cyto.a.23779
- Nolan JP, Condello D. Spectral flow cytometry. Curr Protoc Cytom. 2013;Chapter 1:doi:10.1002/0471142956.cy0127s63 https://www.ncbi.nlm.nih.gov/pmc/articles/PMC3556726/
- John P. Nolan, Danilo Condello, Erika Duggan, Mark Naivar, David Novo Visible and near-infrared fluorescence spectral flow cytometry J, 2012 https://doi.org/10.1002/cyto.a.22241


