Aberrant cell proliferation and cell death underlie a multitude of disease states
Normal tissue homeostasis depends on a critical balance between cell proliferation and cell death. The cell cycle regulates the former, while the latter occurs via controlled self-destruction, better known as apoptosis or programmed cell death. Dysregulation of these processes can be catastrophic and has been linked to conditions including cancer, coronary artery disease, and many different neurological and autoimmune disorders. When developing therapeutic agents for these pathological conditions, it is common for researchers to monitor the cell cycle and apoptosis using techniques such as flow cytometry, high content imaging analysis, and various functional assays. Here, we highlight some of the dyes used for these applications and comment on popular experimental strategies.
Introduction to cell proliferation and the cell cycle
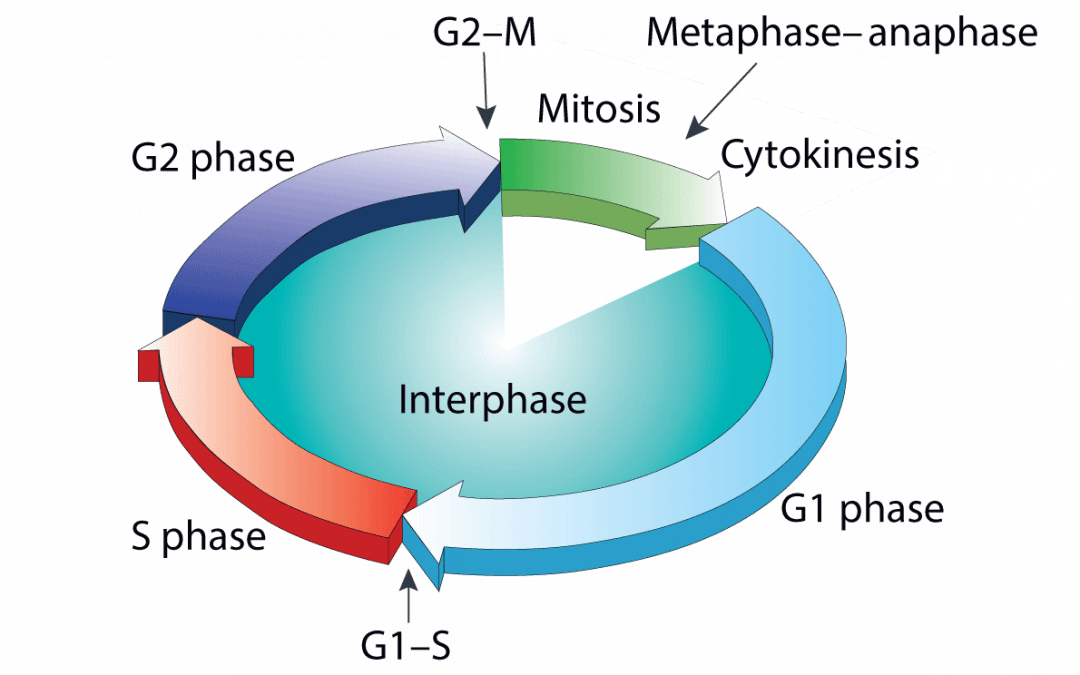
In eukaryotes, cells are replenished or their numbers increased as a result of normal physiology. This occurs via the cell cycle, a tightly-controlled sequence of events that enables an individual cell to divide into two identical daughter cells. The cell cycle comprises four distinct phases – G1, S, G2, and M – of which G1 is usually the longest. During G1, cells continually monitor their environment for growth-inducing signals; upon encountering these signals, they initiate production of any requisite proteins before committing to DNA synthesis (S phase). Cells then continue to grow during G2, prior to undergoing mitosis (M phase). To progress through the cell cycle, cells must pass through numerous checkpoints. These include the G1/S checkpoint, which ensures environmental conditions are favorable for replication, and the G2/M checkpoint, which safeguards the integrity of cellular DNA and targets any irreparable cells for apoptosis. Errors in these checkpoints can lead to cell death or uncontrolled cell division, a classic hallmark of cancer.
Methods for monitoring cell proliferation and the cell cycle
A broad range of methods has been developed for monitoring the cell cycle. Flow cytometry is one of the most common methods to assess cellular DNA content for discrimination between G1, S, G2 and M. This involves staining cells with dyes that bind stoichiometrically to DNA. Well-known examples include propidium iodide (PI), 7-amino actinomycin-D (7-AAD), Hoechst 33342, and 4’6’-diamidino-2-phenylindole (DAPI). An alternative approach is to use fluorescently-labeled antibodies for detecting key cell cycle markers such as cyclins, retinoblastoma, and phosphorylated histone H3, which fluctuate in terms of activity and expression as the cell cycle progresses. More recently, other cell cycle analysis products to reach the market include BD Biosciences’ Cycletest™ Plus DNA Reagent Kit for preparing isolated nuclei for DNA analysis by flow cytometry, and Luminex’ Muse® Cell Cycle Kit that provides benchtop quantitation of cell cycle distribution. To determine cell proliferation rates, researchers may choose to stain cells with 5′-bromo-2′-deoxyuridine (BrdU), a thymidine analog that, when incorporated into newly synthesized DNA, halves in fluorescence intensity each time the cells divide. It is also possible to monitor well-characterized proliferation proteins, for example, using Chromotek’s Cell Cycle-Chromobody® to visualize the proliferating cell nuclear antigen (PCNA) in live cells.
Introduction to apoptosis
Apoptosis removes unwanted cells from an organism, including those generated in excess during the course of an immune response, as well as cells that are virus-infected or have sustained irreparable DNA damage. It is distinct from cell death due to injury (necrosis) in that it involves cell blebbing and controlled disintegration into apoptotic bodies which are then phagocytosed. Necrotic cells instead swell and burst, releasing inflammatory mediators into their immediate surroundings to cause the destruction of neighboring cells. Apoptosis is initiated through two main signaling pathways: the intrinsic and extrinsic pathway. The former is triggered when damage occurs within the cell and is mediated by mitochondrial responses. The latter is induced by unfavorable conditions in the extracellular environment. Intrinsic stresses include DNA damage, hypoxia, and withdrawal of survival factors, while external stresses encompass factors ranging from ligands (e.g., death ligands and FasL) to UV-B irradiation, γ-irradiation, reactive oxygen species, and various chemotherapeutic drugs. Dysregulated apoptosis is implicated in multiple disease states, including cancer, stroke, and Alzheimer’s disease.
Methods for studying apoptosis
Because many of the changes associated with apoptosis may also be seen during other cellular processes, researchers often run several apoptosis assays in parallel. One popular assay involves using fluorescently-labeled Annexin V to measure the lipid phosphatidylserine (PS) translocation from the inner to the outer plasma membrane by flow cytometry. An event typically occurs during early apoptosis. Another common strategy is to monitor the activation of the caspase cascade using fluorescently-labeled antibodies for techniques such as flow cytometry or high content imaging analysis. Apoptosis is also studied by assessing mitochondrial function, such as by detecting mitochondrial superoxide production (e.g., using Thermo Fisher Scientific’s MitoSOX™ Red Mitochondrial Superoxide Indicator) or analyzing of mitochondrial pore activation (e.g., with Abcam’s Mitochondrial Permeability Transition Pore Assay Kit). And by evaluating mitochondrial health (e.g., using a dye known as JC-1). Strategies for monitoring DNA fragmentation include terminal deoxynucleotidyl transferase dUTP nick end labeling (TUNEL) assays for detecting DNA breaks and analysis of chromatin condensation with products such as Enzo Life Sciences’ NUCLEAR-ID® Green Chromatin Condensation Detection Kit.
Supporting cell cycle and apoptosis analysis
Assays used for analyzing the cell cycle and apoptosis typically produce fluorescent readouts that must often be detected alongside other key cellular parameters. Panel design is therefore critical to ensure accurate results – which is where FluoroFinder can help! Use our Spectra Viewer to quickly compare over 1000 fluorophores from all suppliers in one intuitive platform, including many of the dyes mentioned here, or turn to our Panel Builder to optimize your multiplexed experiments with the very latest fluorophore and antibody offerings across >60 suppliers.


