
Spectral flow cytometry offers several advantages over conventional flow cytometry but may be more affected by spreading error
Spectral flow cytometry was first described in 2004 by the Robinson group at Purdue University Cytometry Laboratories. Since then, several commercial spectral flow cytometers have reached the market, including instruments from Sony Biotechnology, Cytek Biosciences, BD Biosciences, and Thermo Fisher Scientific, and a growing number of fluorophores has been developed, many exhibiting unique spectral properties to further enhance the capabilities of this already powerful technology. Ultimately, by resolving more individual fluorophores compared to using conventional methods, spectral flow cytometry offers researchers deeper insights into how various cell types function in conditions of heath and disease. Here, we provide a brief overview of spectral flow cytometry and share some key considerations for panel design.
Introduction to spectral flow cytometry
Both conventional and spectral flow cytometry have the same underlying principles: cells stained with fluorophore-labeled antibodies are directed in single file past one or more lasers at an interrogation point, then the resultant light scatter and fluorescence signals are used for cellular identification. The main distinction between the two technologies lies in how the signals are detected. During conventional flow cytometry, dichroic mirrors and optical filters guide different colors of light towards photomultiplier tubes (PMTs) or avalanche photodiodes (APDs) for detection, each of which measures a wavelength range corresponding to the emission maxima of a given fluorophore. Spectral flow cytometry instead uses gratings or prisms to separate the light, which is then parallelized by a specialized (collimating) lens and directed linearly across an array of PMT or APD detectors. This array records the full emission spectrum of every fluorophore, meaning that fluorophores with similar emission maxima but different off-peak emissions can be combined in the same panel due to having unique spectral signatures.
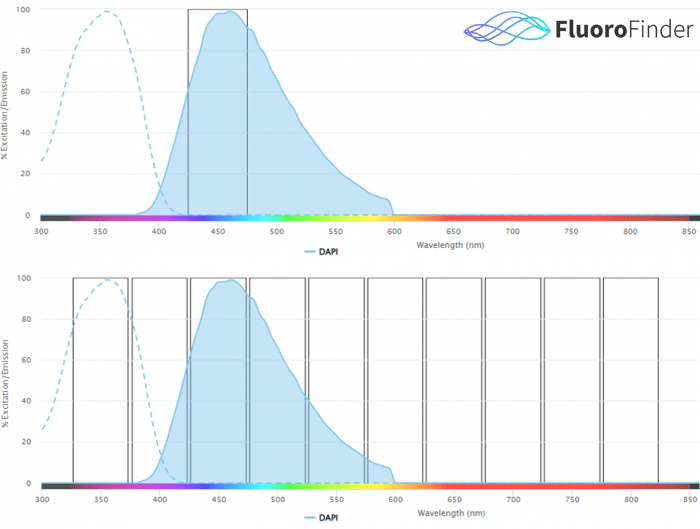
Figure 1.0: Conceptual representation of traditional cytometer signal detection (top), versus spectral cytometer signal detection (bottom). Traditional cytometry instrumentation detects signal from a fluorophore via one laser and one detector, ideally at the peak emission wavelengths. Spectral cytometry instrumentation detects signal from a fluorophore via all lasers and all detectors, over the entire fluorescent spectrum. The collection of many data points across the entire fluorescent spectrum for a single fluorophore allows fluorophores with similar emission peaks to be used together in spectral flow cytometry.
Advantages of spectral flow cytometry
The main advantage of spectral flow cytometry over conventional flow cytometry is that it increases the number of fluorophores that can be used in the same experiment. While many popular conventional flow cytometers can measure more than 20 parameters simultaneously, experiments performed on such instruments typically detect just 5-10 different markers due to constraints around fluorophore compatibility. In contrast, spectral flow cytometers can readily detect upwards of 40 parameters, not only by supporting the use of fluorophores with similar emission maxima but by harnessing novel dyes developed specifically for spectral flow cytometry applications. Examples include BioLegend’s APC/Fire™ 810, which was created to expand spectral detection further into the infrared region, and Biotium’s CF® dyes, which were designed to fill spectral gaps between existing fluorophores. Spectral flow cytometry also provides greater flexibility for panel design since, where an antibody labeled with a particular fluorophore is not available as an off-the-shelf product, reconfiguring the panel to introduce a different label in its place is relatively straightforward. Lastly, spectral flow cytometry can improve detection of scarce targets by treating autofluorescence as a separate color, allowing for its removal during analysis.
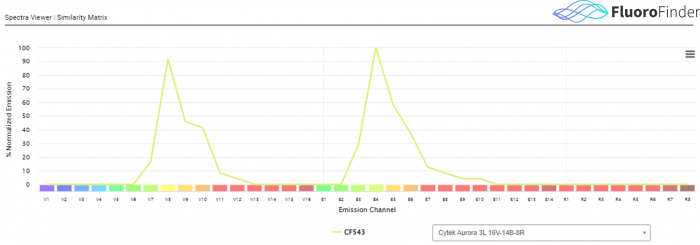
Figure 2.0: Fluorescent spectrum data for spectral cytometry, via FluoroFinder’s Spectra Viewer. While in traditional flow cytometry, a single laser/detector combination is used to assess the signal from a single fluorophore, in spectral flow cytometry all laser and detector combinations detect signal for a single fluorophore over the entirety of the fluorescent spectrum. This example shows CF543 data as generated on a 3 laser Cytek Aurora. This instrument employs 38 fluorescent detection channels to capture fluorescent data from a single fluorochrome.
Spreading error and considerations for panel design
Both conventional and spectral flow cytometry rely on algorithms for correctly identifying the signal from individual fluorophores. Conventional flow cytometry uses compensation, whereby fluorescence spillover is removed based on compensation controls (samples containing both a positive and a negative population that have been stained with a single fluorophore). Spectral flow cytometry instead uses spectral unmixing, which distinguishes individual fluorophores according to their spectral signatures. However, even after compensation or spectral unmixing has been applied, a phenomenon known as spreading error can still occur. Since this is generally more pronounced for larger panels and fluorophores with a broad emission spectrum, it can especially be problematic for spectral flow cytometry. To minimize spreading error during spectral flow cytometry experiments, the following best practices are recommended for panel design:
- Assign bright fluorophores to low abundance markers and dim fluorophores to highly expressed markers
- Where co-expressed markers will be detected, avoid using fluorophores that cannot be distinguished on a conventional flow cytometer (e.g., APC and Alexa Fluor® 647)
- If similar fluorophores (that cannot be distinguished on a conventional flow cytometer) will be combined in the same panel, assign them to different cell types
- Refer to the spread matrix provided by the instrument manufacturer to determine which fluorophores are likely to cause a lot of spreading error then, if alternatives are not available, assign these fluorophores to a dump channel, to low abundance markers, or to markers expressed by a cell type that does not co-express any other markers in the panel
- Refer to the spread matrix provided by the instrument manufacturer to determine which fluorophores are likely to receive a lot of spreading error then, if alternatives are not available, assign these fluorophores to markers with on/off expression where possible
- Always titrate antibodies and fluorophores during assay development to minimize spreading error
Supporting spectral flow cytometry studies
FluoroFinder tools now support spectral flow cytometry! Determining which combination of fluorophores is compatible with your spectral flow cytometer is easier than ever. Use our Spectra Viewer to visualize fluorescent data as generated on spectral analyzers so you can make the best fluorophore choices for your spectral flow cytometry instrument. Additionally, visit our Panel Builder, now with integrated similarity matrix data that enables users to choose compatible combinations of fluorophores for their specific spectral instrument from our 3 million strong, multi-supplier antibody product database. If you need any additional guidance, our technical support team is always happy to help.
Sign up for our eNewsletter to receive regular updates about flow cytometry-based research, including the very latest antibody and fluorophore offerings available to support your studies.


