Marker selection and panel design underpin the accuracy of cellular identification
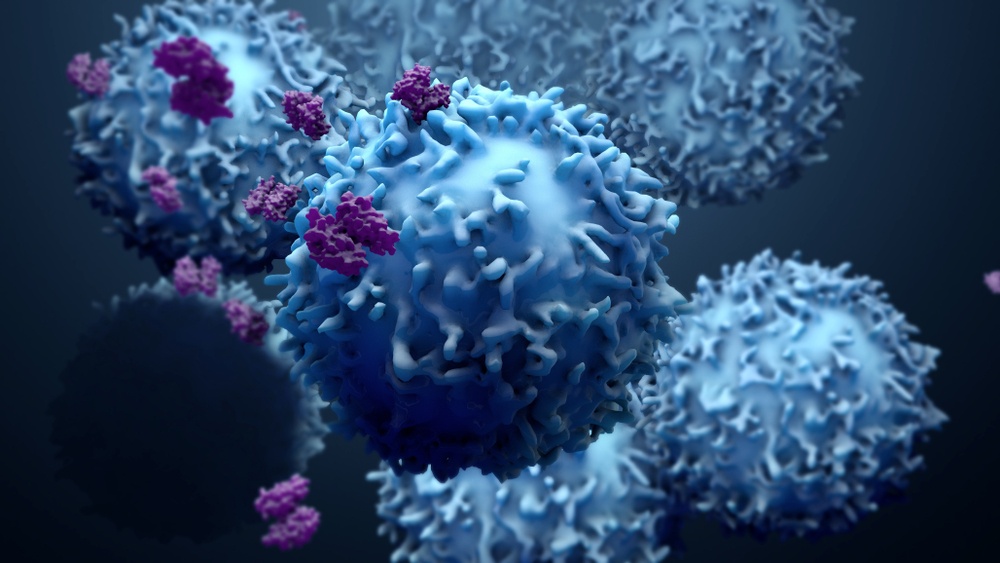
Being able to monitor the presence and relative abundance of different cell types in sample material is essential to understand normal biology and investigate the pathogenesis of disease. Flow cytometry facilitates this by using light scatter and fluorescence intensity to detect specific cell types within a mixed population. While light scatter is a property of cell size and granularity, fluorescence arises from the labeled antibodies used to bind cellular markers. Choosing the right cellular markers for flow cytometry analysis can be challenging due to the fact that many markers are shared across different cell types; for accurate identification, multiple markers must often be detected in combination. Additionally, where markers are expressed intracellularly rather than at the cell surface, their measurement involves rigorous protocol optimization to ensure other epitopes are not compromised. Both marker selection and panel design are critical to ensure reliable results.
Surface vs intracellular markers
Cell surface markers are a diverse array of proteins and carbohydrates that are attached to the cell membrane. While some cell surface markers are involved in protein transport, others have important roles in intercellular recognition and communication. A main advantage of using cell surface markers for cellular identification is that there is no requirement for cells to be fixed and permeabilized. Not only does elimination of these protocol steps shorten flow cytometry workflows, but it also prevents epitopes from being damaged by fixative reagents and detergents.
Although many different cell surface markers have been characterized, it can often be necessary to combine surface marker detection with staining for intracellular markers. For example, the expression of certain intracellular proteins may provide definitive identification of certain cell types or reveal insights into cellular signaling responses. Types of intracellular marker that are routinely analyzed by flow cytometry include cytokines (which are usually trapped inside cells using a protein transport inhibitor such as brefeldin A before fixation), transcription factors, and phosphorylated proteins.
Immunophenotyping
Immunophenotyping is the term used to describe flow cytometry-based analysis of heterogeneous cell populations. The name is derived from the use of antibodies for detecting cellular phenotypes, whereby binding of fluorophore-labeled antibody reagents to one or more specific markers enables identification. Although immunophenotyping protocols vary depending on whether cell surface or intracellular markers are used for identification, the antibody step is fundamental. Depending on the number and types of markers that will be measured at the same time, researchers may choose either to use fluorophore-labeled primary antibodies or to pair unlabeled target-specific antibodies with fluorophore-labeled secondary antibodies for detection.
Immune cell differentiation and CD markers
Immune cells are derived from hematopoietic stem cells (HSCs) present in the bone marrow. These initially give rise to myeloid and lymphoid progenitor cells which then differentiate into distinct cell subsets. While B cells, T cells, and natural killer (NK) cells are derived from the lymphoid lineage, immune cells originating from the myeloid progenitor include basophils, dendritic cells, eosinophils, macrophages, monocytes, and neutrophils. Upon encountering specific stimuli, many immune cells undergo further differentiation in order to perform distinct functions.
During immune cell development and differentiation, marker expression changes, and it is the presence or absence of specific markers that allows cells to be identified. Cluster of Differentiation (CD) markers are the most widely used markers for identifying immune cells and, to date, over 350 CD markers are recognized. However, while some cell types can be identified using just a single CD marker (e.g., CD3 for T cells, CD19 for B cells, and CD14 for monocytes), it is more common for multiple CD markers to be measured in combination. For example, CD markers used for identifying macrophages include CD11b, CD68, and CD163.
Antigen Density
Antigen density is a key consideration for immunophenotyping, not least because such studies typically involve detecting both scarce and highly expressed antigens in the same sample. To avoid low density antigens being masked by more abundant markers, it is suggested that researchers pair bright fluorophores with scarce targets, and vice versa. It may also be helpful to perform cell enrichment prior to flow cytometric analysis. A popular approach is to use marker-specific antibodies conjugated to magnetic beads for capturing cellular subsets from the suspension sample; this provides a smaller starting pool in which to detect the cell type of interest. Alternatively, biotin-antibody conjugates followed by streptavidin-conjugated magnetic particles may be used for the same purpose.
Fluorophore selection
As well as matching fluorophore brightness to antigen density, there are several other fluorophore properties to take into account when detecting cellular markers by flow cytometry. The first of these are the excitation and emission maxima of each fluorophore, which must be compatible with the flow cytometer’s lasers and detectors for accurate measurement. Next is the Stokes shift, which is the difference between the excitation and emission maxima; this can be exploited to allow fluorophores that are excited by the same laser to be combined in the same experiment. Other important factors include the pH sensitivity of each fluorophore, which is especially relevant when multiple fluorophores will be pooled in the same buffer for immunostaining, and its susceptibility to photobleaching. For longer duration flow cytometry studies, or studies necessitating the use of strong lasers, fluorophores that are resistant to photobleaching are usually a preferred choice.
Whichever cellular markers you wish to detect using flow cytometry, we’re here to help! FluoroFinder’s Spectra Viewer enables you to quickly compare over 1,000 fluorophores from all suppliers in one intuitive platform, while our Panel Builder lets you optimize your multiplexed experiments with the very latest fluorophore and antibody offerings across >60 suppliers. And our technical support team is always available to offer guidance and support, irrespective of your chosen sample type or throughput requirements.
Sign up for our eNewsletter to receive regular updates about flow cytometry, including the very latest product offerings for cellular marker detection.


