Although intracellular flow cytometry evolved more recently than surface staining, it is far from new. Reports dating back almost 50 years describe the use of intracellular flow cytometry to track the cell cycle, through differential staining of DNA and RNA with acridine orange, and to determine intracellular pH, by exploiting the pH-dependent excitation spectrum of fluorescein (1,2). But it was in 1980, when fluorescently-labeled antibodies first entered the intracellular flow cytometry scene, that the methodology started to become more powerful3. Today, intracellular flow cytometry is routinely used to simultaneously measure multiple targets, typically in combination with cell surface markers. We spoke with Cell Signaling Technology (CST®) and Becton, Dickinson and Company (BD) to learn more about the types of intracellular markers being investigated and the challenges associated with their detection.
Intracellular Flow Cytometry Targets
“While cell surface proteins, such as the CD (cluster of differentiation) antigens, are widely used for characterizing different cell types by flow cytometry, detecting intracellular molecules can often provide a more dynamic picture,” says Adam Best, Ph.D., Sr. Global Marketing Manager at BD. “For example, comparing the expression of metabolic pathways, or phosphorylation states of intracellular proteins in healthy and diseased sample types, can help determine the status of cell signaling pathways in conditions such as cancer, diabetes, and neurodegeneration.”
“Quantifying protein abundance can be an important indicator of cellular state, but the ability to measure post translational modifications like phosphorylation, acetylation, and protein cleavage at a single-cell level while also being able to identify the type of cell you are looking at is an unrivaled strength of flow cytometry,” adds Chris Manning, Associate Director, Flow Cytometry at CST.
Other common intracellular targets for flow cytometry include:
- Cytokines – e.g., chemokines, interferons, interleukins, and tumor necrosis factors
- Transcription factors – e.g., Signal Transducers and Activators of Transcription (STATs), Hypoxia-Inducible Factors (HIFs), and the Nuclear Factor-κB (NF-κB) family
- Inflammatory mediators – e.g., histamine, bradykinin, prostaglandins, and leukotrienes
- Markers of cell cycle progression e.g., DNA, cyclins, Cyclin-Dependent Kinases (CDKs), and CDK inhibitors
- Markers of cellular proliferation e.g., Ki67, Proliferating Cell Nuclear Antigen (PCNA), and Mini-Chromosome Maintenance (MCM) proteins
- Markers of metabolic activity e.g., ATP Synthase (TCA cycle), Hexokinase 1 (Glycolysis), G6PD (Pentose Phosphate Pathway)
Additionally, various flow cytometry-based protocols have been developed for measuring intracellular mRNA. Examples include the Branched DNA Technique, the Proximity Ligation Assay for RNA (PLAYR), and Fluorescence In Situ Hybridization flow cytometry (FISH-Flow), all of which can be paired with the use of fluorescently-labeled antibodies for detecting cell surface and intracellular protein markers (4,5,6). Advantages of these methods over standard techniques for quantifying mRNA include the fact that they provide information on a single-cell basis, as well as allow for correlating transcription with protein expression.
Challenges for Intracellular Flow Cytometry
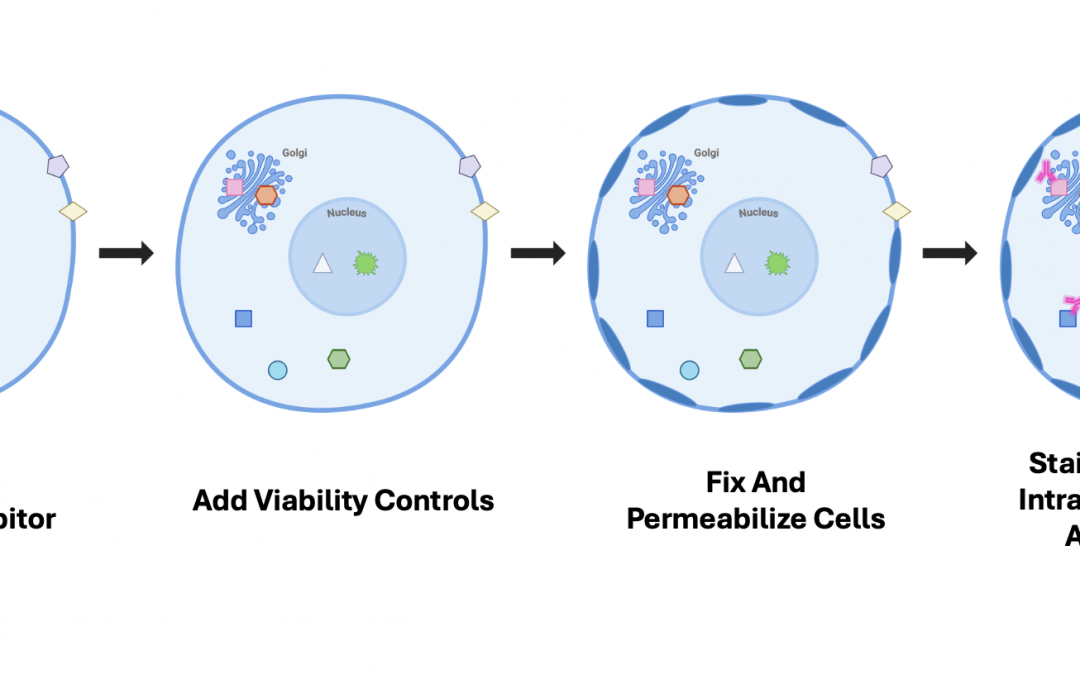
A typical flow cytometry protocol for detecting cell surface markers begins with preparing a single-cell suspension. Next, non-specific binding sites can be blocked using normal serum, and an additional Fc blocking step may be performed to prevent antibodies from binding to Fc receptors. The cells are then stained with fluorophore-labeled antibodies, either via direct or indirect detection, before being introduced into the flow cytometer for data acquisition and analysis. The main difference between this method and staining for intracellular markers is that the latter necessitates fixing and permeabilizing cells for antibodies to reach their targets.
“A major challenge for intracellular flow cytometry is that a wide variety of fixation and permeabilization protocols has been developed, not all of which will be compatible with every antibody and fluorophore,” explains Manning. “This can make it a challenge when designing large panels, especially when incorporating antibodies that are normally used on live cells. At CST, we maintain our Flow Cytometry Protocol Compatibility Table so that researchers can see how many popular surface marker antibodies and intracellular clones perform across our commonly recommended protocols.”
It is also important to note that several common viability dyes, including propidium iodide (PI), 7-aminoactinomycin D (7-AAD), and 4′,6-diamidino-2-phenylindole (DAPI), are not suitable for use in a fixation protocol. In this setting, a fixable viability dye, such as a CST Ghost Dye™ or a BD Horizon™ Fixable Viability Stain, should be added to the cells prior to fixation. Moreover, when detecting secreted proteins, such as cytokines, the use of a protein secretion inhibitor (e.g., Brefeldin or Monensin A) is required to enable their detection.
OMIPs Based on Intracellular Cytokine Staining
Optimized Multicolor Immunofluorescence Panels, better known as OMIPs, are published, peer-reviewed panels for characterizing a specific cell type or cellular response by flow cytometry or other fluorescence–based methods. To date, over 100 different OMIPs have been developed, including the following examples based on intracellular cytokine staining:
- OMIP-014 – a 12-color staining panel for multi-functional characterization of antigen-specific human T-cells, which has been used to evaluate HIV- and TB-specific responses in cryopreserved peripheral blood mononuclear cells (PBMCs) from adult humans (7).
- OMIP-025 – an expansion and modification of OMIP-014, for measuring 16 different markers, this OMIP was optimized using cryopreserved PBMCs from HIV-infected and uninfected adults with known cytomegalovirus (CMV) responses (8).
- OMIP-056 – a further evolution of OMIP-014 and OMIP-025, this 26‐color staining panel allows for characterizing antigen‐specific CD4+, CD8+, γδ, mucosal‐associated invariant T, and NK T cells as well as conventional NK cells (9).
Spectral Flow Cytometry with Real-Time Spatial and Morphological Insights
Historically, flow cytometry has not provided researchers with images of individual cells, leading certain information to remain hidden. However, it is now possible to visualize cells in flow with instruments such as the BD FACSDiscover S8 Cell Sorter. “The BD FACSDiscover S8 Cell Sorter is the first and only real-time imaging, spectral flow cytometer that lets researchers sort cells based on real-time spatial and morphological characteristics,” says Best. “With the BD FACSDiscover S8 Cell Sorter, it is possible to sort cells according to the location of specific intracellular proteins, for even deeper insights into each cell.”
Supporting Your Research
FluoroFinder has developed a suite of tools to streamline your flow cytometry experiments. Use our Antibody Search function to find antibodies that are validated for flow cytometry, then leverage our Panel Builder to select fluorophores that match your instrument’s laser and filter configurations.
- https://pubmed.ncbi.nlm.nih.gov/822422/
- https://pubmed.ncbi.nlm.nih.gov/35567/
- https://pubmed.ncbi.nlm.nih.gov/6268385/
- https://pubmed.ncbi.nlm.nih.gov/29071675/
- https://pubmed.ncbi.nlm.nih.gov/26808670/
- https://pubmed.ncbi.nlm.nih.gov/28518171/
- https://pubmed.ncbi.nlm.nih.gov/23081852/
- https://pubmed.ncbi.nlm.nih.gov/25407958/
- https://pubmed.ncbi.nlm.nih.gov/30919583/


