A technique that combines flow cytometry with digital microscopy promises novel insights
Imaging flow cytometry (IFC) has seen increased uptake in recent years, largely due to instrumentation and software improvements that have made the technique more accessible. By combining the high throughput nature of conventional flow cytometry with the imaging capacity of digital microscopy, imaging flow cytometry has allowed researchers to perform new types of experiments and has revealed insights that might otherwise have been overlooked using either technique alone. Here, we explain why imaging flow cytometry is growing in popularity and comment on some of the different research areas that have benefited from its use.
What is imaging flow cytometry?
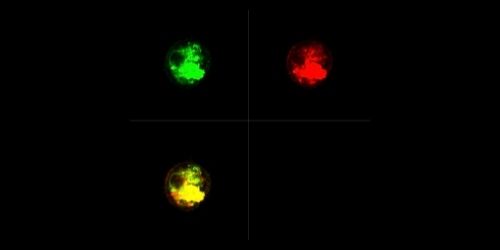
Imaging flow cytometry is a technique based on both conventional flow cytometry and digital microscopy. Like conventional flow cytometry, it is capable of analyzing large numbers of individual cells extremely rapidly. However, while each fluorescent signal in conventional flow cytometry equates to a whole cell, imaging flow cytometry allows researchers to see exactly where in the cell the signal is coming from. This is achieved by capturing a digital image of each cell as it moves through the flow stream and enables researchers to perform highly detailed morphological analysis. By combining the statistically relevant cell numbers of conventional flow cytometry with the spatial resolution of digital microscopy, imaging flow cytometry offers unique insights into target expression, even for extremely rare cell populations.
What types of studies use imaging flow cytometry?
Many different research groups have been keen to reap the benefits of imaging flow cytometry, especially those focused on determining where in the cell specific proteins are expressed, whether those levels fluctuate over time, and if other proteins are co-localized with the target of interest. For example, using imaging flow cytometry, it has been possible to monitor autophagy in mammalian cells by quantifying the co-localization of LC3, p62, and lysosomal LAMP1 – a method that provides a fuller picture of autophagic flux than studying each marker in isolation. Imaging flow cytometry has also been used to examine the nuclear localization of various transcription factors, including FOXO1, a protein with a critical role in directing the development of different lymphocytes. Other studies based on imaging flow cytometry include cell cycle analysis, where researchers have been able to investigate the distribution of key molecules throughout the four main phases of mitosis, and interrogation of the immunological synapse that is formed between dendritic cells and T cells. Additionally, imaging flow cytometry has seen widespread use for characterizing extracellular vesicles, tiny structures that have long required better tools for their accurate measurement, and to visualize antibody-dependent cell-mediated cytotoxicity (ADCC) of cancer cells. Imaging flow cytometers have even become submersible, with CytoBuoy’s CytoSense instrument being used to study water quality up to 200 meters below the surface.
How has imaging flow cytometry become more accessible?
Like any flow cytometry experiment, the success of imaging flow cytometry hinges on experimental design. The same panel constraints apply to IFC as to conventional flow cytometry – namely, for optimal results, brighter fluorochromes should be paired with less abundant targets (and vice versa) and panels should always be constructed to ensure as little spectral overlap as possible – but a main differentiator between the two techniques is that imaging flow cytometry produces far richer data. Even with the best-designed panel, making sense of multiple morphological features for thousands of individual cells can be a formidable task. For this reason, imaging flow cytometer manufacturers have developed and implemented various measures to make data analysis more intuitive.
Luminex is a major player in the field of imaging flow cytometry, offering both the Amnis® ImageStream®X Mk II and the Amnis® FlowSight® instruments within its product portfolio. These are complemented by a broad range of software tools that have been designed to ensure IFC is accessible to users of any experience level. At one end of the scale, wizard-based analysis software can be paired with core applications, while for applications outside of these, other wizards help determine which features might best be used to identify a particular target. More advanced software leverages machine learning to automate analysis across different experiments, while at the other end of the scale, Amnis® AI software uses artificial intelligence for highly reproducible sample characterization.
Fluorophore selection for imaging flow cytometry
Broadly speaking, selecting fluorophores for imaging flow cytometry is no different than selecting fluorophores for conventional flow, so you can use FluoroFinder’s familiar tools to streamline your IFC panel design. Our Spectra Viewer lets you quickly compare over 1000 fluorophores from all suppliers in one intuitive platform, including many fluorophores that have been literature-cited for imaging flow cytometry, while our Panel Builder enables you to optimize your multiplexed experiments with the very latest fluorophore and antibody offerings across >60 suppliers. So what’s stopping you? Gain novel insights from your samples by integrating imaging flow cytometry into your workflow today!


