Written By Kelly Lundsten
Strategies for Spectral Matching
The spectra of a fluorophore is often called its fingerprint or a unique distribution of photons along a defined increment of wavelengths that represents the probability that the chemical structure, upon excitation and relaxation, will emit a photon at any one of those wavelengths. In its native chemical form, unconjugated to an antibody, the spectra of a fluorophore is determined using a spectrofluorometer by the reagent manufacturer. A fluorometer serves two functions, to determine the optimal wavelength of excitation and emission. It scans along a gradient of excitation wavelengths in 1 nm increments, called a monochromator, and monitors the intensity of the output at different wavelengths to find the excitation wavelength that corresponds with peak emission intensity. Then, at a continuous illumination of that optimal excitation wavelength, the fluorometer can scan the emission range in 1 nm increments to construct a display of intensity across the visible range. The unit of output is relative intensity and does not represent the specific brightness of a single molecule of that fluorophore. To determine actual fluorophore brightness, you would need additional information like the extinction coefficient and quantum efficiency of the fluorophore in that solution. Typically, an emission scan will begin after the excitation peak wavelength through 850nm or longer, depending on the spectral properties of the fluorophore. It is wise to be suspect of excitation or emission spectra that do not follow this good practice.
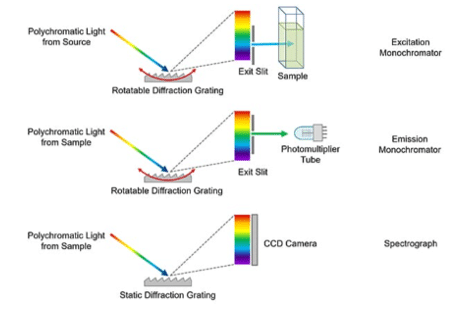
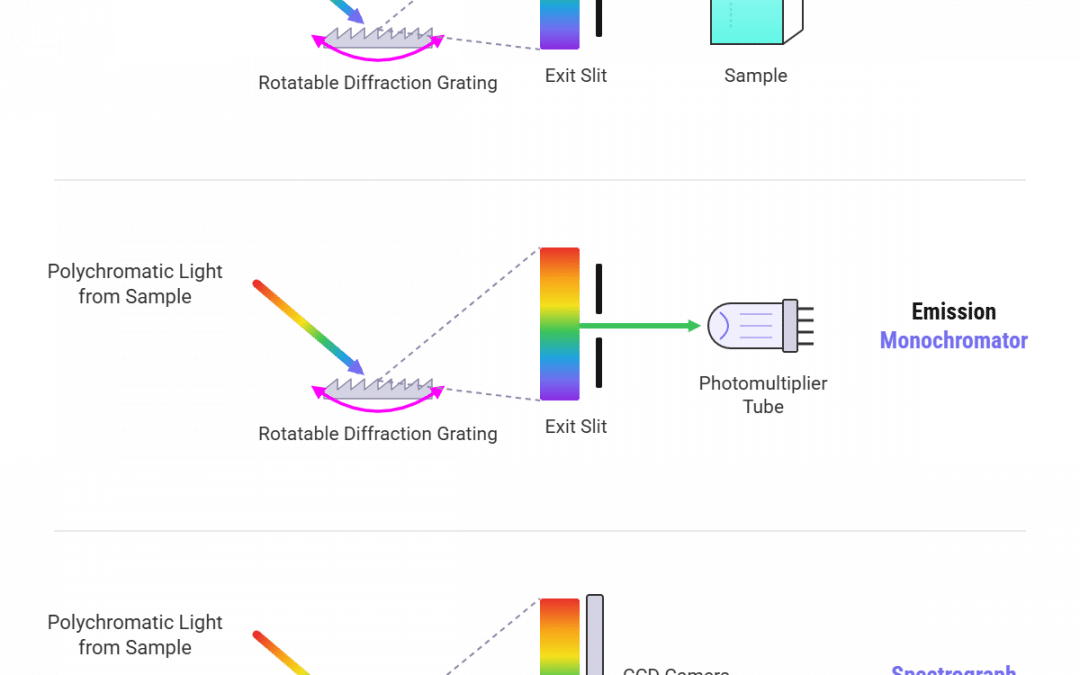
Figure 1: The basic operating principle behind monochromators and spectrographs. It should be noted that these images are highly simplified for illustration. For example the monochromators used in the Edinburgh Instruments FS5 and FLS1000 are a more complicated Czerny-Turner design which have two slits and two ellipsoidal mirrors for superior performance but the principle remains the same.
In flow cytometry, it is a common occurrence for new brands of fluorophores to be released without a clear explanation of whether they are novel in their spectral characteristics or advantageous in their utility. Here we will give you some tips and tricks to interpret the value and differentiation of commercially available fluorophore products.
Are fluorophores with overlapping spectra the same?
Generally, the rule of thumb is that if excitation and emission profiles overlay within a few nanometers of variance on a traditional spectrophotometric display like the conventional Spectra Viewer on FluoroFinder, it is highly likely that they are equivalent structures. There are many examples of this. In this graphic we show how the overlays of Oyster 488 with Alexa Fluor 488, ECD with PE-Texas Red, and cFluor R668 with Alexa Fluor 647 overlap with high homology. Because these spectra are normalized to 100% peak intensity, it does not reflect on their individual brightness.
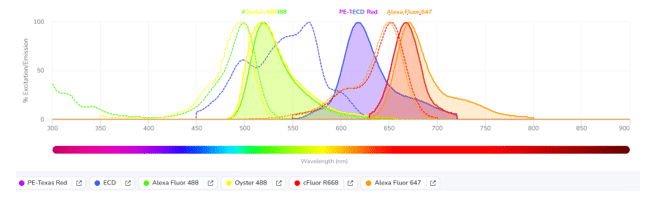
Figure 2: Spectral overlays overlapping with high homology on FluoroFinder’s Spectra Viewer.
Recently, new fluorophore families have emerged with the branding monicker, PLUS or Bright. Even though the spectra overlay identically, PLUS or Bright branding generally indicates a non-fluorescent chemical modification that makes one version of the fluorophore brighter than the non-PLUS or non-Bright equivalent. Examples would be Spark B550 and Spark PLUS B550 or Vio R720 and VioBright R720.
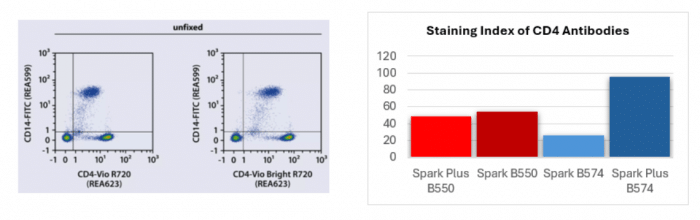
Figure 3.1: Human peripheral blood mononuclear cells (PBMC) were stained with a CD19 antibody conjugated with Vio Bright R720 or Alexa Fluor 700 (Miltenyi Biotec). Cells were analyzed by flow cytometry using the MACSQuant® Analyzer 16. | 3.2: Data generated on CytoFLEX mosaic-88 with UV laser option
What can change the brightness and/or spectrum of a fluorophore?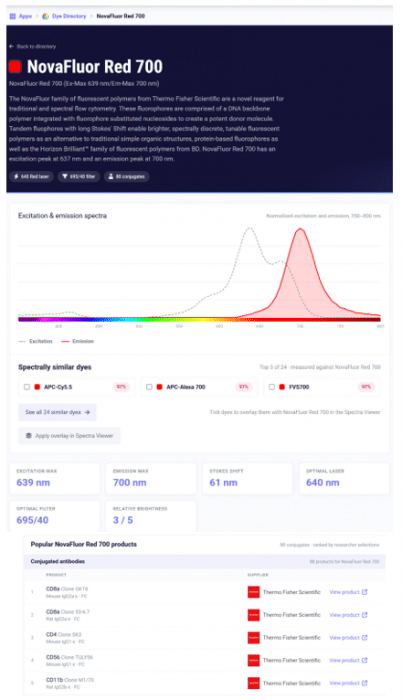
There are exogenous physical factors surrounding a reagent, called the microenvironment, that can influence the fluorophore’s ability to resonate energy efficiently, causing a change in the brightness of the reagent. Some examples would include a hydrophobic fluorophore, like Bodipy FL, being used in an aqueous environment, like a solution of PBS. Being in a non-ideal environment causes the fluorophore to dim compared to its potential brightness. If the Bodipy FL in this example were to find a lipid particle or a hydrophobic membrane to bind, it would become increasingly more quantum efficient in that environment and it’s brightness would increase commensurately. Other examples would be probes like nucleic acid stains or probes sensitive to pH or membrane polarization that are fluorogenic meaning that they only fluorescent upon binding of their target. In some instances probes designed in this manner may also shift spectra in a way that reflects a differential attraction and binding to the target. An example of this would be the cell permeant JC-1 that exhibits a spectral shift when it aggregates within the mitochondrial membrane of healthy cells but disperses upon membrane neutralization associated with apoptosis. The density of JC-1 creates a ratio between the monomer emission at 529nm and the aggregate emission at 590 nm.
There is also a proximity-based impact on the brightness and spectra of a fluorophore. Förster Resonance Energy Transfer (FRET) is the phenomenon of a transfer of energy between one conductive biomolecule to another, most frequently discussed in the context of flow cytometry in the construction of tandem fluorophores. This is where one molecule, the acceptor, is excited by a short wavelength of energy where it enters an excited state while it resonates that energy within its electronic pi cloud. If another fluorophore is within a molecular distance of around 10 angstroms, it will directly transfer that energy to the electrons of the neighboring fluorophore, causing it to enter its own excited state. This transfer of energy then quenches the donor, deescalating it from its excited to resting energetic state without the emission of a photon of light from the donor. This method is essential to 80% of the reagents we use in flow cytometry and allows us to use a limited number of lasers to excite many more fluorophores with unique emission peaks, diversifying the number of parameters we can detect at any given time. The flip side of this phenomenon is collisional quenching. Similar to FRET, it occurs only when fluorophores are close to one another, but rather than being excited by the transfer of electronic energy, a neighboring fluorophore will instead have their excited state interfered with by the electrons of a neighbor, causing both of them to quench without the emission of a photon.
What is unlikely to be causing a change in the emission profile of a fluorophore is a situation where in the use of a fluorescently conjugated antibody, there is a change in the emission profile of the fluorophore upon binding the target protein of the antibody. Upon conjugation or covalent cross-linking of the fluorophore to the antibody in its manufacturing, the fluorophore would now be encompassed into the body of the antibody, surrounded by protein, and it would be highly unlikely to come into close enough contact with another fluorophore conjugated to a neighboring antibody in order for there to be an electronic exchange of energy. The discussion of why some fluorophores have slightly different spectral profiles when carried by a compensation bead versus a single stained cell with an intent to use them for compensation or unmixing is the topic for another newsletter. However, in this instance, spectra can be influenced by the brightness of the signal and the noise of the background. With that in mind, the practical in situ spectrum of a fluorophore directly reflects the signal to noise ratio constructed from each channel of the instrument.
As fluorophore choices continue to expand from so many different manufacturers, the different online Spectra Viewers from FluoroFinder are a helpful tool to help guide panel design. Recently, the Dye Directory has also received a facelift, making it easier to filter the directory of 1350 fluorophores based on excitation and emission spectra, manufacturer or based on their brightness scaling. Each fluorophore landing page contains a description of what makes the fluorophore unique or similar to others and a quick link to a product database containing more than 3 million antibody products. There are many tools at your disposal to take the mystery out of your reagents and make it easier to integrate them into panels that suit your instrument and assay needs.
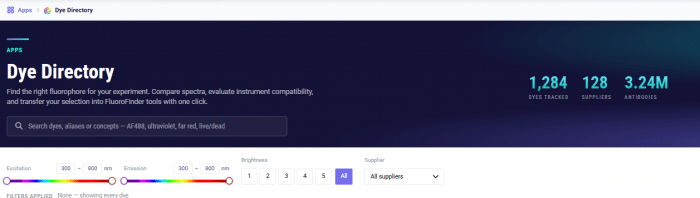
Figure 4: The updated design of FluoroFinder’s Dye Directory