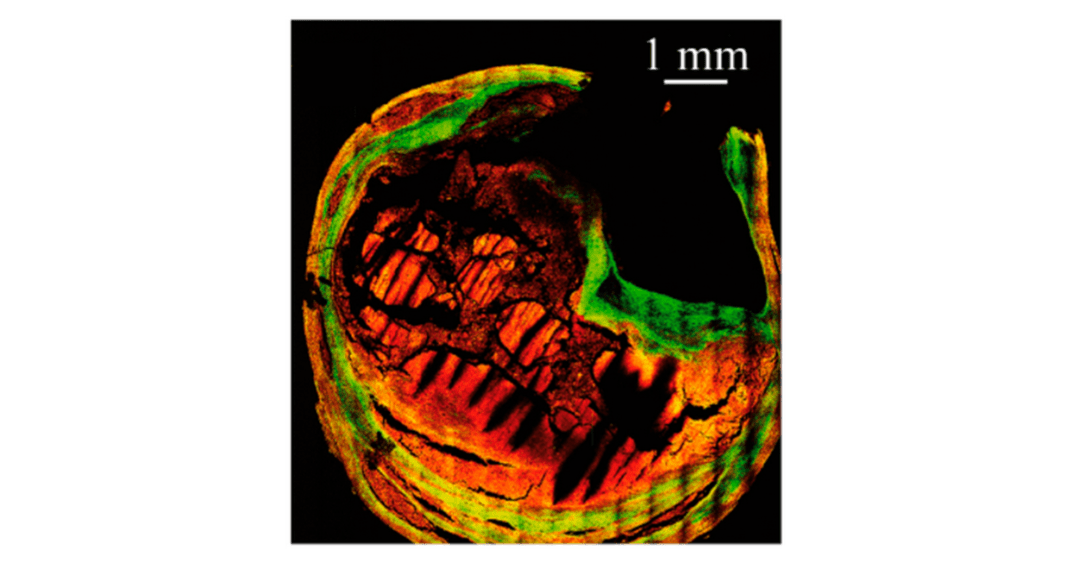
Cover Image: Multiphoton (red) and Second Harmonic Generation (green) image of a human carotid cross-section. Used without modification under Creative Commons Attribution 4.0 International License from (Marchetti, 2019).
Written by Sarah Locknar, Ph.D.
From imaging cancer biomarkers in a biopsy to neuronal mapping in the brain, clinicians and researchers are constantly striving to identify more biomolecules in fewer samples. The traditional method of multiplexed immunofluorescence, which involves labelling multiple targets with fluorescent antibodies and separating the emission signals with bandpass filters or a spectrometer, is limited to about 6 fluorophores at a time. Cyclic immunofluorescence solves that limitation by iterative antibody stripping and relabeling. Another approach, multimodal imaging, uses different imaging technologies, including fluorescence lifetime imaging (FLIM), second harmonic (SHG) and multiphoton imaging, Raman microscopy and mass spectroscopy imaging (MSI) to learn even more about each sample. This article outlines many of these modalities and multiplexing within them.
Fluorescence Lifetime Imaging Microscopy (FLIM)
FLIM, like other immunofluorescence methods, usually requires labelling the sample with fluorescent markers. Unlike traditional immunofluorescence where signals are separated by spectral differences, the contrast in FLIM comes from differences in excited state lifetimes between fluorophores. In fact, fluorophores with identical emission spectra can be differentiated solely on their fluorescence lifetimes. The excited state lifetime of fluorophores is highly influenced by the local environment (polarity, polarizability, pH, etc.) and can range from picoseconds to hundreds of nanoseconds. Pulsed excitation (via laser or widefield illumination) excites the fluorophores, and emission is acquired between pulses as a function of time (using time-gating or time-correlated single photon counting). Fluorescence decay is fit to exponential decay curves and displayed as a pseudo-colored image. For a good review of different FLIM techniques and hardware, see (Poudel, 2020). Most multiplexing in FLIM is performed in the time domain, but excitation-wavelength multiplexing has also been described in commercially available systems. Complete systems are available from a number of manufacturers including Becker & Hickl, Leica and Lambert Instruments. In live cells, multiplexing can be achieved using specially designed fluorogen-activating (FAST) proteins. (Bogdanova, 2024) These small proteins only become fluorescent when bound with a fluorogen. This technique allows for tuning of the lifetime properties of the fluorescent complex by genetically optimizing the protein binding pocket (Figure 1).
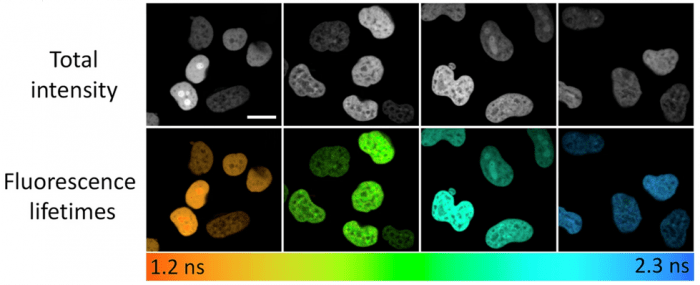
Figure 1. Fluorescence lifetimes of one fluorogen in complex with 4 FAST variants expressed as H2B fuses in live HeLa cells. Color-coding represents fluorescence lifetime obtained as a result of monoexponential fluorescence decay fitting. Scale bar 20 microns. Used without modification under Creative Commons Attribution 4.0 International License from (Bogdanova, 2024), Figure 3b.
Multiphoton Imaging and SHG
Multiphoton imaging uses two (two-photon excited fluorescence – TPEF) or three-photon excitation with a high-powered, pulsed NIR laser to excite extrinsic (visible) or intrinsic (UV) fluorophores such as tryptophan, tyrosine, phenylalanine, and nucleic acids. The pulsed laser also gives rise to second-harmonic signals (SHG, at ½ the laser wavelength) when interacting with ordered molecular structures without a center of symmetry (e.g. fibers of collagen or myosin, DNA and cholesterol crystals). Detecting both multiphoton and SHG signals is straightforward – multiphoton excitation spectra tend to be quite broad, so multiple labels can be excited simultaneously and spectrally filtered into UV, SHG and visible bands in the detection path. Commercial multiphoton microscopes are available from all major microscope manufacturers. FLIM images can also be acquired (2p-FLIM) with changes to the detection protocol, pulse sequence and data analysis routines. 2p-FLIM is available as an add-on module for Bruker’s multiphoton systems.
Raman Microscopy and Advanced Variants
Raman microscopy is an inelastic scattering technique, extracting contrast from the vibrational modes of molecules. A laser beam rasters across the sample, as in other laser scanning methods, but a fraction of the light returning to the detector is shifted in wavelength by the frequency of vibrational modes in the sample. Spectra are generated by converting wavelength to frequency in wavenumbers (cm-1) and subtracting the frequency of the laser beam. Raman microscopy can be used to identify classes of molecules such as water, lipids, proteins and DNA, individual proteins or entire organisms (Figure 2). (Pezzotti, 2021) Taking advantage of the narrow bandwidths of vibrational transitions, Raman probes have been designed for up to 20-plex detection using a single laser. These are based on alternating single and triple carbon bonds (polyynes) which are not present in biological tissues and thus give distinct peaks in the Raman spectrum. Increasing the length of the polyyne chain causes a 40 cm-1 shift in the peak position. (Hu, 2018) Commercial Raman microscopy systems are available from Bruker, Oxford Instruments, Horiba, Renishaw, and ThermoFisher.
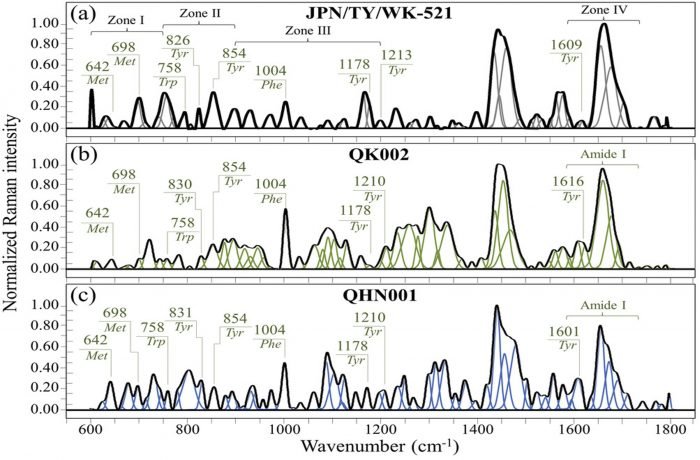
Figure 2. Raman spectra of COVID variants in the frequency interval 600–1800 cm−1of a) the original Japanese isolate JPN/TY/WK-521, b) variant QK002, and c) variant QHN001. Spectra are normalized and deconvoluted into Gaussian-Lorentzian band components. Used without modification under Creative Commons Attribution 4.0 International Licensefrom (Pezzotti, 2021), Figure 1.
Variants of Raman microscopy have been developed to increase the signal (and speed) of traditional Raman microscopy (typically only one shifted photon for every million incident photons). These include SERS (surface-enhanced Raman spectroscopy) and TERS (tip-enhanced Raman spectroscopy – available from Horiba) which use metallic structures to enhance signals near the metal surface, SRS (stimulated Raman scattering) and CARS (coherent anti-stokes Raman scattering) which use non-linear optical techniques and multiple lasers to boost signal. Leica’s STELLARIS CRS microscope enables SRS, CARS, SHG, TPEF and visible confocal in a single system, while Renishaw’s Renishaw inViaTM system has optional modules that integrate Raman with a variety of other modes including FLIM, SHG and immunofluorescence. Custom instruments have also been developed that combine label-free imaging modalities of Raman, CARS, SHG, multiphoton and FLIM. (Marchetti, 2019) (Xu, 2025).
Mass Spectrometry Imaging (MSI)
The above modes all use various wavelengths of light and their interactions with the sample to give image contrast. Another way to achieve contrast uses the mass and charge of ionized molecules and molecular fragments to determine the composition at a point in the sample. This is called mass spectrometry imaging (MSI) It is a destructive technique, in that the top layer of the sample is eroded away as molecules are fed into the mass spectrometer. The image is formed by rastering across the sample with precision motors.
There are three basic techniques to get the biomolecules off the surface and into the gas phase for subsequent analysis- DESI, MALDI and SIMS.
DESI
Desorption ElectroSpray Ionization (DESI) uses a jet of pressurized, electrically charged solvent to partially dissolve and release surface molecules. The spatial resolution is approximately 50 microns and it can release molecules up to 2 KDa with very little sample prep. This method is ideal for large-area scanning and is the most gentle ionization method.
MALDI
Matrix-Assisted Laser Desorption/Ionization (MALDI) is another relatively gentle method that uses UV laser excitation of a matrix to supply the energy to expel molecules into the spectrometer. Spatial resolution is about 20 microns and molecules up to 100 kDa can be analyzed in this way. MALDI requires careful sample preparation including application of the matrix to achieve good results (Shimma, 2014).
SIMS and MIBI
Secondary Ion Mass Spectrometry (SIMS) is a hard (more destructive) ionization method that uses a focused primary ion beam to sputter secondary ionized molecules off the surface and into the spectrometer. This method gives the highest spatial resolution (<10 micron), but also the smallest mass range (up to 1 kDa).
Multiplexed ion beam imaging (MIBI) is a variant of SIMS that uses metal-isotope conjugated antibodies with unique spectral signatures. The choice of metals and isotopes enables high multiplexing. (Angelo, 2014) (Ptacek, 2020) The Hyperion XTi imaging system from Standard Biotools is based on this technology and can image up to 40 probes at once. Cameca/Ametek offers NanoSIMS instruments with resolution in the 10s of nm. It has been used with halogen-isotope conjugated antibodies to study nuclear structures (Figure 3). (Rovira-Clave, 2021)
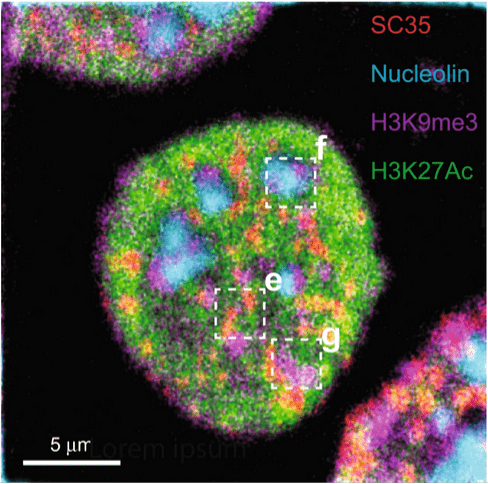
Figure 3. Composite HD-MIBI image of nucleolin (cyan), H3K9me3 (magenta), H3K27Ac (green), and SC35 (red) in a HeLa cell. Cells were stained with anti-nucleolin-19F/FITC, anti-H3K9me3-81Br/Cy3, anti-H3K27Ac-127Ir/Cy5, and anti-SC35-biotin (recognized by streptavidin-197Au/FITC). The image consists of the sum of 10 consecutive planes. n = 3. Used without modification under Creative Commons Attribution 4.0 International License from (Rovira-Clave, 2021), Figure 2d.
Comparison of Multimodal Imaging Techniques
The table below summarizes key differences in contrast mechanism, multiplexing potential, spatial resolution, and sample impact across major multimodal imaging techniques.
Table 1. Comparison of multimodal imaging techniques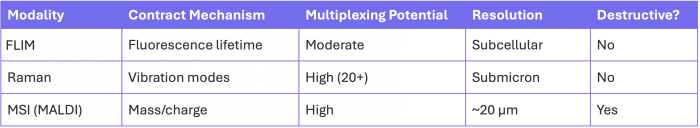
Combining Optical and MSI Modalities
As described in the previous paragraphs, there are many examples of combining optical modes to achieve multiplexed, multimodal imaging. It is more unusual to find examples of optical modes and MSI modes in a single instrument. A Raman/MALDI protocol (RaMALDI) using a 1,5-diaminonaphthalene matrix has been described (Yang, 2023) and applied to cryosections of kidney and brain. Raman imaging is performed first, followed by MALDI MSI.
Advantages and Limitations of Multimodal Imaging
Multimodal multiplexing imaging provides much more information than a single mode, but it also has a few caveats. Using different modes on a single sample can cause problems if the samples are damaged during the data acquisition phase of a single mode. For example, Raman and FLIM imaging can cause photodamage due to long data acquisition times, and MSI can erode away surface molecules. There can also be differences in resolution between modes that require additional image processing algorithms. Other purely structural methods like atomic force microscopy, scanning electron microscopy, brightfield, darkfield and polarized microscopy can also be integrated with many of these techniques to give researchers more insight that ever before. Keep an eye out as more modes are developed and new commercial offerings become available in this active area of research.
Supporting Your Research
Planning a multiplexed imaging experiment? Use our Cell Types Tool to identify target antigens on your cell type of interest, then head over to our Antibody Search function to find antibodies validated for immunofluorescence, or our Fluorescent Dye Directory to research reagents compatible with your microscopy setup. To further support Microscopy experiments, FluoroFinder is developing:
- The Cyclic Immunofluorescent Panel Builder – a tool designed to identify appropriate reagents for your experiment, optimize immunofluorescence rounds, and track the iterative process of designing Cyclic IF panels.
- Microscopy Spectra Viewer – configure your microscope and leverage the Microscopy version of our Spectra Viewer to select the best dyes for your setup.
If you or a colleague is interested in contributing towards the development of these tools with ideas, beta testing, or feedback, please contact support@fluorofinder.com.
References:
- Angelo (2014). doi:10.1038/nm.3488
- Bogdanova (2024). doi:10.1038/s42003-024-06501-1
- Hu (2018). doi:10.1038/nmeth.4578
- Marchetti (2019). doi:10.3390/mps2020051
- Pezzotti (2021). doi:10.1002/advs.202103287
- Poudel (2020). doi:10.1088/2050-6120/ab7364
- Ptacek (2020). doi:10.1038/s41374-020-0417-4
- Rovira-Clave (2021). doi:10.1038/s41467-021-24822-1
- Shimma (2014). doi:10.5702/massspectrometry.S0029
- Xu (2025). doi:10.3791/68845
- Yang (2023). doi:10.1016/j.bios.2023.115597
About the Author
 Sarah Locknar has a Ph.D. in Physical Chemistry from Carnegie Mellon University. She was director of


