Guest Authored By: Kelly Lundsten
Every living organism on earth has evolved to either harness or protect itself from the energy of the sun. Organic molecules capture energy and conduct it along a circuitry of electron pairs shared by double bonds that compose various aromatic ring structures, the most fundamental of which can be found in nucleosides and amino acids. The distinction between a colored molecule, a chromagen, and a fluorescent molecule, a fluorophore, is that the former absorbs or reflects specific wavelengths of energy, while the latter not only absorbs energy but is energetically transformed, resonating energy, releasing non-radiative energy as heat and vibration, until it relaxes back to its ground state through the emission of a radiative photon of energy. In evolution, both chromagens and fluorophores protect DNA from damage due to UV irradiation in the form of molecules like melanin and lipid soluble vitamins like Vitamin E in the skin. Both chromagens and fluorophores, based on their chemical structures, are wavelength-specific. For example, protein quantitation utilizes the absorption potential of the smallest aromatic components at 280nm, aromatic amino acids like phenylalanine, tyrosine and tryptophan. Smaller conjugated ring structures are excited by shorter, higher energy wavelengths of light while larger ones are excited by increasingly longer wavelengths of energy. Thus, as a general rule, with some exceptions, the smaller the fluorophore, the shorter the excitation wavelength and emission while the largest, synthetically made fluorophores we use in cell analysis are sensitive to infrared, >700nm energy.
Nature doesn’t typically expend the energy to create very large individually fluorescent structures which is why autofluorescence, or the endogenous fluorescence of naturally occurring molecules in plants and animals, are excited optimally in the shorter wavelength range, typically 320-450nm. In nature, if a molecule excites >450nm, it’s often a complex of two fluorescent molecules. An example of this is NAD (Nicotinamide Adenine Dinucleotide) and FAD (Flavin Adenine Dinucleotide), the two most basic energetic units of oxidative phosphorylation and the production of ATP in mammals. Both NADH and FAD contribute ribose and the fluorescent adenosine nucleotide to the ATP reaction. However, FAD also contains an additional organic structure called a flavin. In Figure 1, compare the structure of flavin in FAD to fluorescein. Although not identical, molecules nature has made are often repurposed into the kinds of fluorophores we use in biological research through chemical optimization for spectral properties, brightness, solubility and pH stability.
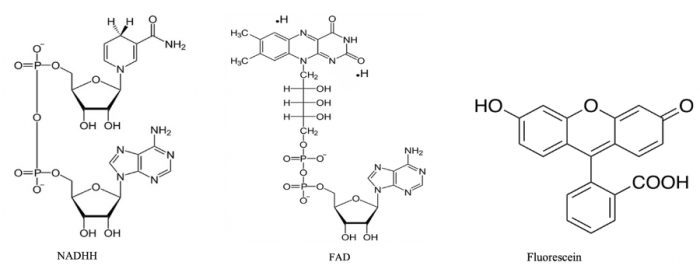
Figure 1. Chemical structures of NADH, FAD, and Fluorescein.
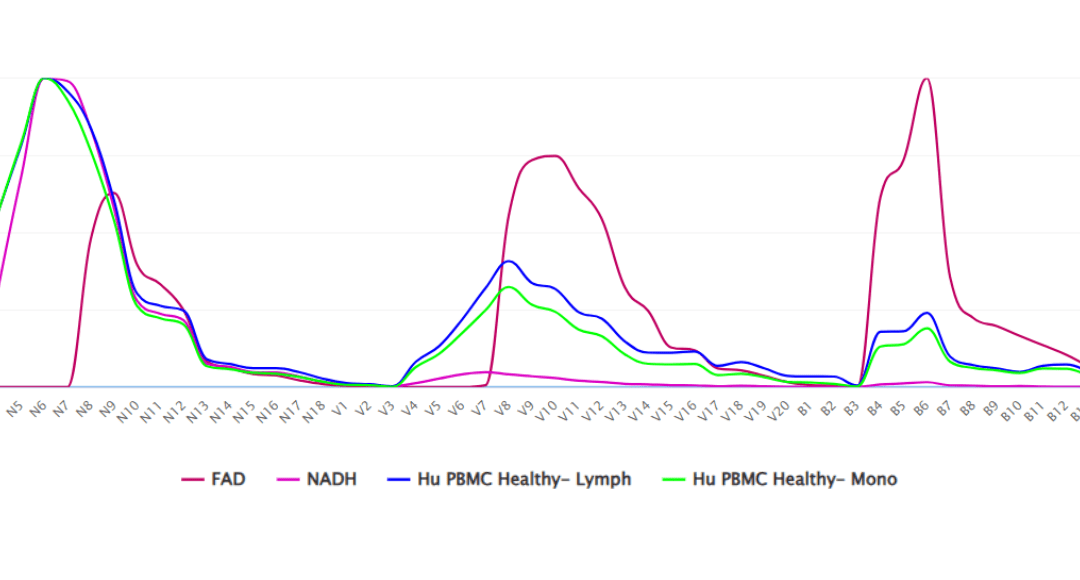
Now compare the spectrum of both NAD and FAD in Figure 2. NAD has excitation in the NUV and a single peak of emission. FAD, on the other hand, is excited by the NUV, 405nm and 488nm lasers. This spectrum in Fig 2 is from a first of its kind collection of researcher-donated spectra collected on a range of different spectral flow cytometry instrumentation. Specifically, the NAD/FAD plot is displayed on a CytoFLEX mosaic-88 with a near-UV 370nm option in addition to 405/488/561/633 and the 808nm lasers. We often use the term “spectral fingerprint” as the spectrum is unique to the chemistry of the fluorophore. Looking at this spectral overlay, the averaged autofluorescence of lymphocyte (blue) and monocyte (green) scatter gated populations show the individual peaks contributed by both NAD (pink) and FAD (red). The NUV emission peak is clearly created by the contribution of NAD and the 488nm emission peak is clearly contributed by FAD. However, the emission peak resulting from the 405nm laser does not belong to either of them.
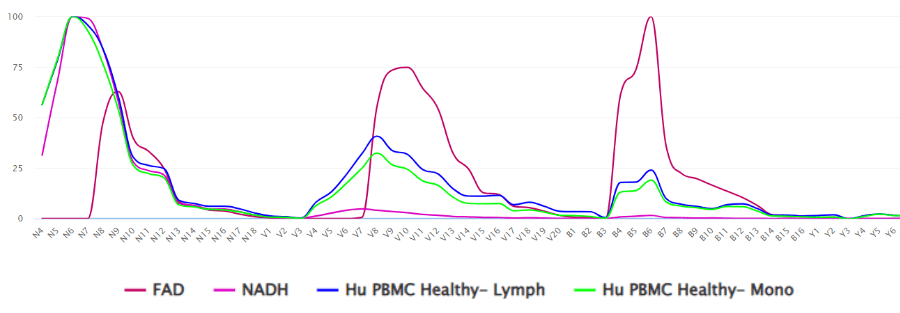
Figure 2. Spectrum of NADH and FAD collected on a CytoFLEX mosaic-88. Overlay shows averaged autofluorescence of lymphocytes (blue) and monocytes (green) compared with individual spectra of NAD (pink) and FAD (red).
This is called single source (the FAD and NAD) versus multi source (the averaged autofluorescence of the cells as a population) autofluorescence. Rather than simply unmix and extract averaged autofluorescence in an attempt to make it easier to use phenotypic cellular markers in that same spectral range, the next dimension of spectral flow cytometry is to identify the individual sources of the autofluorescence to expand the use of the technology to assess biologically meaningful changes in the respiration and biochemistry of individual cells in health and disease. The implications for metabolomics is significant.
Outside of traditional immunological applications, Fig. 3 is another example contributed by the University of York and collected on the CytoFLEX mosaic-88 with the UV and IR lasers in addition to the 405/488/561/633nm laser combination. Whereas the spectral distribution shown in Figure 2 shows the spectral fingerprints in a fashion where the spectra are normalized, which means that their emission peaks are normalized to 100% on an intensity scale, Figure 3 is showing the spectral fingerprints of 4 cyanobacteria species, Thalassiosira, Chlorella, Chlamy and Synechococcus plotted as relative intensity values that can be directly related to the actual brightness, comparatively speaking, of each species.
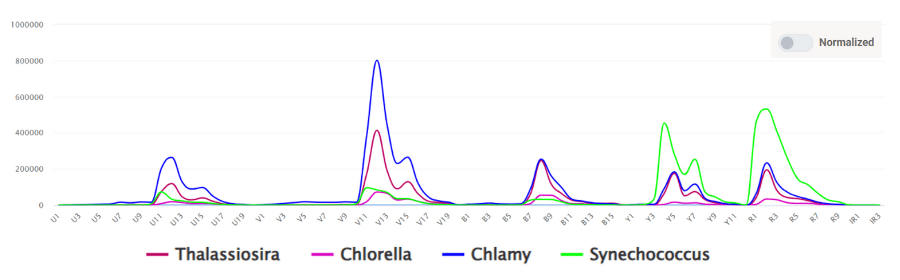
Figure 3. Spectrum of four cyanobacteria species (Thalassiosira, Chlorella, Chlamydomonas, and Synechococcus) collected on the CytoFLEX mosaic-88..
Supporting Your Research
There is still a lot of work to be done to collect the spectra of single and multi-source autofluorescence we might find occurring in humans, plants and other living organisms. If you are interested in contributing to this effort by joining this working group, or by submitting submitting exported spectra (in Excel or CSV format), please contact us at support@fluorofinder.com. You can visit FluoroFinder’s newly released Autofluorescence Spectra Viewer here.*
*Access to our Spectra Viewers is free, but you must be logged into your FluoroFinder account for the link to the Autofluorescence Spectra Viewer to work. You can sign in here. Don’t have a FluoroFinder account yet? Sign up for one here.


