
Back before spectral cytometry, flow cytometers were composed of optical configurations with individual photomultiplier tubes (PMTs) or avalanche photodiodes (APDs) behind filters centered at the peak emission of different fluorophores. Many might call these “traditional” flow cytometers.
When a newly purchased instrument is first placed in a facility, it is best practice to do a voltage walk, also called voltration, to assess where the “sweet spot” of performance is for all the detectors. The “sweet spot” is defined by the voltage or gain range where the staining index values are the highest and do not significantly change in performance across a wide gain/voltage range. The voltages of PMTs are then tested each day (hopefully) using a multicolor bead in a QC process to detect any significant deviation from the previous day’s QC.
It is a very engineering-centric way of assessing the integrity of the optical path components and this daily QC remains as relevant today on all instruments, traditional or spectral. Thermo Fisher has a nice article on this method in BioProbes-78. However, how we use those QC settings as the foundation for setting the voltages applied to an assay, has significantly changed from traditional to spectral flow cytometry.
Manually Setting Voltages for Assays
In the past, those of us attempting to maximize all possible channels for the highest parameter level that a traditional instrument could afford, would manually determine our own voltages for the assay based on the QC settings. By taking a single-color biological control, which often also served as the compensation control, or by sampling a small volume of the fully stained sample, you determined the voltage where the populations were (1) on scale within the linear range of the detector, (2) appeared by eye to have sufficient resolution and (3) where the intensity of the fluorophore was strongest in the channel associated with its peak emission. It was not an automated process, but with about 30-45 min of preparation time, voltages were set “by eye” for the assay. There was no additional measure or guidance for voltage setting that was actually based on optimal performance of the biological assay itself.
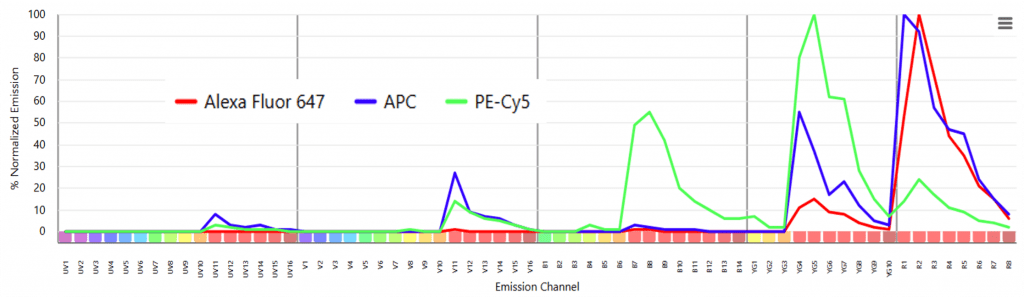
To explain the evolution of why voltage guidance became a necessity as the parameter level of an instrument and spectral complexity of a panel is increased, let’s use a specific example like Alexa Fluor 647 and PE-Cy5. It’s first important to note that Cy5 and Alexa Fluor 647 are almost structurally and spectrally identical. Thus, when a cell tagged with PE-Cy5 passes through each laser line, the Cy5 is directly excited off the 633nm laser with the same efficiency as Alexa Fluor 647. We call this cross-beam excitation.
On traditional instruments, the set-up process would be to run a sample of the Alexa Fluor 647 single color control and make sure it is the brightest reagent in its own channel and ensure PE-Cy5 is not brighter than Alexa Fluor 647 in that channel but instead is the brightest reagent in its own channel off the 561nm laser.
Failing to set up controls in this manner and instead running an assay only on the voltages determined by the QC process, would result in compensation values above 100%, a symptom of unbalanced PMT voltages. This is an imprecise and time-consuming process that is not great at anticipating dramatic differences in antigen density across biological samples. It’s also not a sustainable practice when you are trying to balance the voltages of 88 optical channels of a spectral cytometer rather than the 12-20 channels of a traditional cytometer.
The Need for Automated Voltage Setting
With the widespread adaptation of spectral cytometry, it was identified early by manufacturers that automated voltage balancing was imperative for accurate detection of the true spectrum of a fluorophore and the complexity of that task with so many channels could not be left up to the “eye” of the operator, no matter how experienced. The precise spectrum of the fluorophore is the only physical attribute we have to confidently detect and identify the presence of an antibody/marker/protein combination. Ensuring that the spectral fingerprint of the fluorophore has integrity—that when run on an instrument it emits into each channel with the same efficiency and distribution as one might expect from its photo-physically determined spectrophotometric profile—is essential for unmixing fluorophore combinations with heavily overlapping spectral profiles.
The best example of this is unmixing APC and Alexa Fluor 647 which have a spectral similarity score of 90%. APC and Alexa Fluor 647 emit in the first two channels of the red laser and peak in R1 and R2 of a Cytek Aurora respectively. If I manually lower the voltage of the R1 channel, both fluors will emit equally into the R2 channel, making them much more difficult to spectrally differentiate and increasing the spectral overlap score. The physical spectra of the fluorophores hasn’t changed, but how the instrument reconstructs or “sees” their spectrum changes.
Automated Voltage Setting for Assays
So how do manufacturers determine voltages for automated assay settings? Not too dissimilarly than the manual strategy previously described.
First, understand that PMTs and APDs are not equally sensitive to the near-infrared emission range. To further complicate that issue, most multicolor calibration beads do not contain fluorophores that emit into the near-infrared, making it a challenge to calibrate NIR detectors >700nm (an exception is the Beckman Coulter CytoFLEX Daily IR QC Fluorospheres). Also, the fluorescence that comes from a calibration bead does not represent real spectra from fluorophores that will be used in an assay and do not emit with equal intensity across the detectable range of each laser bank.
Optimally, as a first step, manufacturers will set an MFI target, say 20K RFU (relative fluorescence or intensity units), for each channel within the ~450-650nm emission range, a wavelength range where PMT and APDs generally are quite efficient and where calibration beads emit sufficient photon signal strength. In that emission range, using a prep of beads, the gain/voltage will be steadily increased to meet the MFI target of 20K. Outside of optimal emission ranges, like less than 450nm or greater than 650nm, the MFI target will be much lower. Another exception to this method is that the first channel or two of the detection array, the channels where bright fluorophores (and the donor fluorophores in tandem dyes) like BV421 and PE will emit are often lower MFI targets accommodating very bright signals. However this practice also artificially reduces the apparent spillover values associated with incomplete energy transfer between the donors and acceptors in a tandem, often called the “spill-back” of, for example, PE-Cy5 into the PE channel.
The next step is to use antibody capture beads or stain lymphocytes with an array of CD4 conjugates to test whether the MFI target method results in a voltage balance where each fluorophore emits primarily into its peak emission channel. It is the fine-tuning step of this work towards automated settings to guarantee that highly overlapping fluors which have different peak emissions will fall into their appropriate channel.
Lastly, the assay voltages need to be automatically set upon QC for the user by a conversion done by the software. The process described above should have been done by the manufacturer in development so that all that is left for the user to do is regular QC and let the software assemble the right correction factors to set voltages and gains for optimal assay performance based on any variation in QC and component performance. Basically, this whole process should remain somewhat invisible to the end user whose only responsibility is to understand the difference between QC and optimal assay settings.
Working with Automated Voltage Settings
From this point, it is not optimal to change the voltage and gain values. They are in balance and if adjustment is required due to an off-scale signal, the best course of action is first to titrate the reagent to put the signal on scale, which is also a best practice to mediate the impact of spreading error on data as well. If that is not possible, best practice is to reduce all gains/voltages across laser banks by the same percentage so as not to change the balance and thus spectral distribution. If that is also not possible, and the only course of action left is to reduce an individual channel gain/voltage, it is possible that some combinations of fluorophores will no longer be accurately unmixed and the total parameter number of a panel might need to be reduced.
A favorite resource for understanding the basics of voltage tuning on traditional cytometers in flow cytometry is a presentation from Tom Ashhurst and Adrian Smith at Centenary Institute/University of Sydney and a video blog on voltration from Aja Rieger at University of Alberta. Also, setting MFI targets is not limited to spectral cytometry. The EuroFlow Consortium published a 2012 paper outlining guidelines on how to set MFI QC targets for performance standardization between different traditional instruments.
It is important to understand the differences between these methods. Each calibration step is important but for different reasons as it relates to optimal assay performance. It is also important for high parameter instrument manufacturers to provide automated assay settings as new and more complex instrumentation emerges. The future of flow cytometry is industry-wide standardization of both instrument and assay conditions and an expectation to adhere to a quality data standard no matter the application or platform. With great power comes great responsibility in this full spectrum world.
Supporting Your Research
As automated voltage and gain settings become standard in flow cytometry, our resources help you navigate these advancements and maintain consistence in your experiments. The Spectral Flow Cytometry version of FluoroFinder’s Spectra Viewer can help you visualize fluorophore spectra, anticipate spectral spillover, and further ensure optimal fluorophore selection. With FluoroFinder, you can confidently design high-parameter panels while minimizing variability and maximizing reproducibility.


