Whether you are using a traditional cytometer that employs compensation and does not exceed 18 colors or a spectral cytometer that employs an unmixing algorithm and has the potential, currently, to analyze 50 color panels, the basic tenets of flow cytometry panel design remain fundamentally the same. We will expound on these design principles to understand how they impact spectral flow cytometry. The following are the basic rules of panel design… expanded.
Match antigen abundance to fluorophore brightness and understand which channels will provide the best staining index.
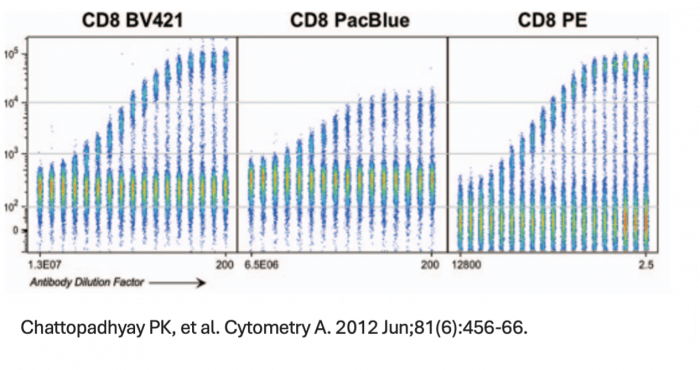 We can all agree that in an application, PE and BV421 are two of the brightest fluorophores. However, brightness is a perception that has as much to do with noise within a detector, autofluorescence of the cell sample or efficiency of a detector at each emission wavelength we employ as it does with the individual molecular brightness of the fluorophore. In the case of BV421 and PE, there are higher levels of autofluorescence in the BV421 channel than the PE emission channel due to endogenous vitamins and metabolic cofactors. These autofluorescent molecules impact the staining index, which is a measure of signal:background that also includes a measure of the width of the negative/unstained peak and thus a measure of how easy it will be to resolve a particular marker/fluorophore combination. For spectral cytometry, however, more than the amplitude of the autofluorescence, the central concern is whether the autofluorescent emission spectrum from each event or cell is the same. If I am working with a cancer tissue sample taken from a patient receiving a chemotherapeutic, where only a fraction of cells belonging to a subset may be activated, have internalized the drug or undergone apoptosis, I would want to consider the variability of the autofluorescent spectrum before I dedicate a fluorophore that overlaps that autofluorescence emission range to a marker of unknown expression pattern or that is particularly important to the biological question of the assay. A strength of spectral flow cytometry is the ability to unmix autofluorescence but this function is also error-prone if I have a heterogenous mixture of cells that individually exhibit different spectral signatures.
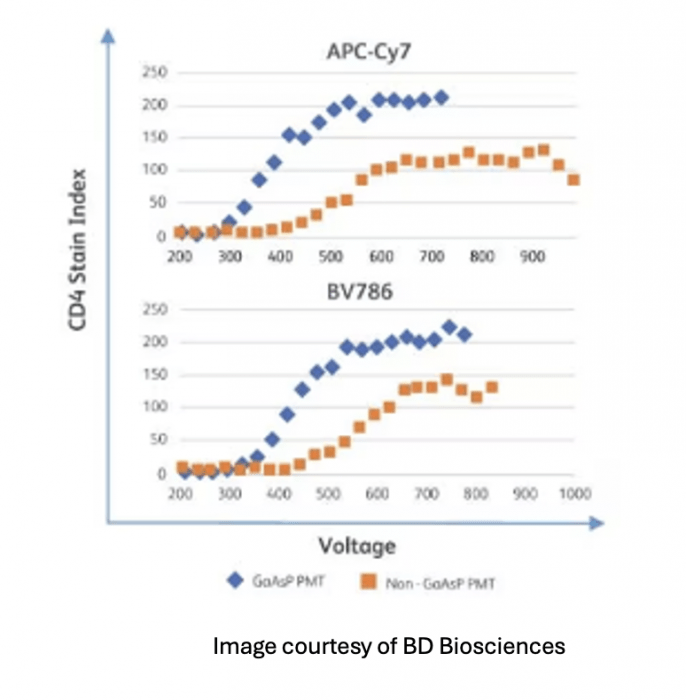 Also, APDs and PMTs are not equally sensitive to the range of emission we employ in flow cytometry. Gallium arsenide phosphide (GaAsP) alloy PMTs are more efficient than traditional PMTs in general but are more expensive and thus typically only used to enhance sensitivity in the NIR emission channels. Also, APDs are more sensitive than even GaAsP PMTs in the NIR. So, consider what brightness really means when matching fluorophores to markers in panel design or when attempting to transfer a panel developed on one instrument to another. Two instruments are rarely equal in sensitivity.
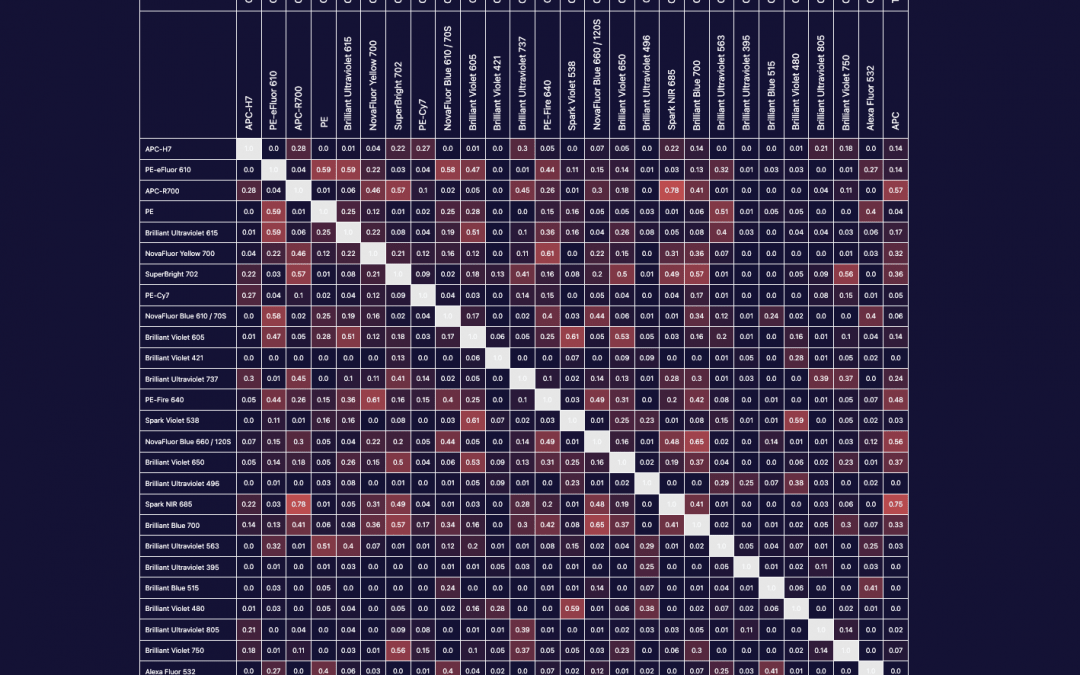
Avoid combinations of markers conjugated to fluorophores with heavy spectral overlap that co-express on the same cell.
Another term for this is the spillover matrix when describing the emission of a fluorophore into non-intended or spillover channels and complexity index when describing the total spectral overlap of all the marker/fluorophore combinations employed in the assay. With spillover index, a fluorophore emitting into its intended channel, the channel that covers its peak emission, will be 1 or 100%. Spillover values of that fluorophore into neighboring channels of the same laser or any emission resulting from crossbeam excitation from a non-optimal laser line will be less than 1. Complexity index, on the other hand, does not have a maximal value. It is simply a number that increases as more reagents are included in a panel. It is a practical tool to help the researcher gauge in real time the consequences of different fluorophore combination choices.
A significant advantage to using the IntelliPanel tool, which will automatically suggest marker/fluorophore panel components, is that it will calculate the optimal combination of fluorophores based on an attempt to achieve the lowest complexity index within the markers you’ve defined for a co-expression group. In the example shown here, the total complexity index calculated for a 28 color panel on a BD Symphony A5 with 30 emission channels may be 8.95, but within only the markers that co-express, groups entitled B cells, DC, Lymphs, M1, M2 et in this example, the spectral overlap is lower.
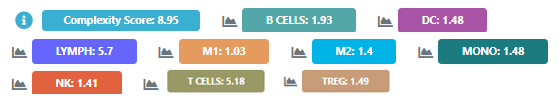
This is not a calculation any of us can do in our heads and it’s a very important measure of the potential success of a panel. The higher the complexity index score within a co-expression group, the greater the threat that the resultant spillover spreading error will distort the data and prohibit the adequate spatial resolution of populations for clear gating. This is the most prohibitive issue we encounter as the number of fluorophores increases, no matter if it be traditional or spectral platforms.
New fluorophore development focuses quite a bit on designing next generation reagents with less and less spectral spillover whether that be a fluorophore with a narrow range of emission, better quenching of the donor molecule partner in a tandem relationship or limiting the crossbeam excitation efficiency of a fluorophore. A good practice when optimizing a panel for spectral cytometry is to test out more current reagent offerings that were developed with an understanding of the negative impact spectral spillover can have. FluoroFinder offers spectraviewers that accurately reflect a fluorophores spectral spillover in the context of specific spectral flow cytometer configurations that is a good aid when planning a panel. Another good practice is to draw out your proposed gating scheme to understand which markers will be co-expressed prior to attempting to build the assay, even if you plan to analyze by viSNE or UMAP.
Always employ a viability probe and don’t dismiss the need for blocking buffers.
Dead cells are a culprit for non-specific binding of reagents. They also can have autofluorescent profiles that do not match live cells leading to errors in unmixing. And finally, dead cells are not always degraded to the level of fragments that might easily be excluded by employing a scatter gate. If you do not have a cell sample with sufficient dead cells to use as a suitable unmixing control, consider using Slingshot’s ViaComp particles that can bind either nucleic acid stains or amine-reactive live/dead reagents.
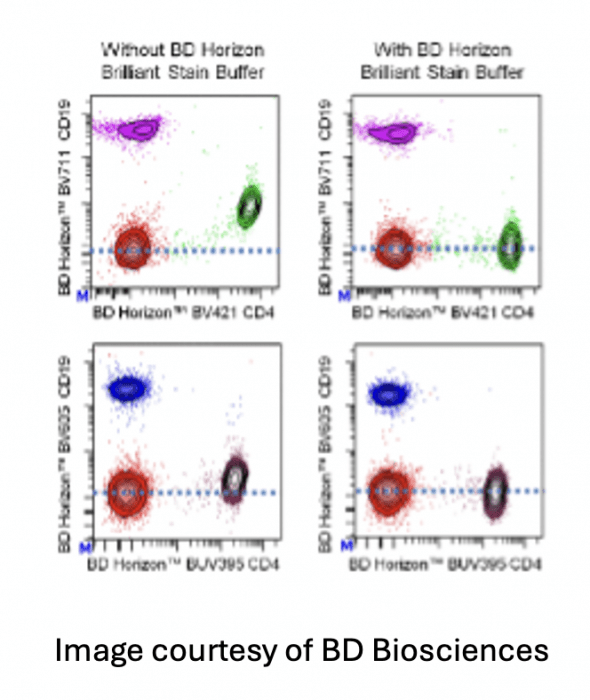 There are many blocking buffers at well that can make a significant impact on the quality of the data. The Brilliant polymer family of fluorophores exhibit non-specific binding of the polymers to each other. The result are analysis plots where the populations look undercompensated and shift towards the center. Since the issue is non-specific binding due reagent interaction, the buffer needs to be present prior to creating the antibody cocktail or staining solution.
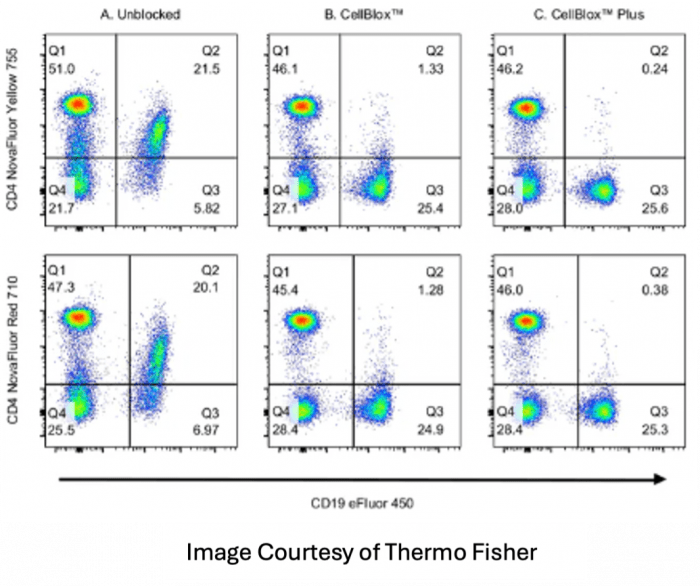 Monocyte blocker is also available from many vendors including Biolegend and Thermo Fisher for the purpose of blocking unwanted binding of certain fluorophores to monocytes. This is an effect often seen with PerCP, PE and APC tandem dyes like PE-Dazzle 594, PE-Cy5, PerCP-Cy5.5 and APC-Cy7. The buffer should also be used with all of the DNA backbone dyes like the NovaFluor and KiraVia fluorophores. In this instance, since the non-specific binding is due to a function of the cell itself, the buffer needs to be exposed to the cell sample prior to the addition of any reagents to be an effective blocker.
Fc receptors are expressed on many antigen-presenting cells including monocytes, dendritic cells, B cells and granulocytes. Using this blocker can mediate any non-specific binding due to the Fc portion of the antibody, avoiding any potential false positives. If you are excluding these cells from analysis, then Fc block isn’t required, however it also doesn’t hurt the staining either.
Planning is everything when it comes to reliable, reproducible assay development.


