Biologists are very interested in how proteins, lipids and other compounds are organized and interact in systems. Very few organizational details can be gained by using standard transmission-based light microscopy, even when employing phase or other contrast-enhancing techniques (differential interference contrast, polarization, etc.). This is where fluorescence microscopy comes in. Fluorescent labels are used to visualize compounds at a cellular and sub-cellular level, by using the specificity of fluorescently-tagged antibodies in immunofluorescence methods, usually in fixed samples. In living cells and organisms, structural elements can be tagged with small fluorescent molecules that preferentially partition into organelles, membranes or DNA, or by directly expressing fluorescent proteins of interest (GFP and the like). There are also fluorescent indicators that can be used to dynamically assess pH, ion concentrations, membrane potential and other cellular properties. Researchers often want to visualize a large number of cellular components in a single sample. However, the nature of the fluorescence signal generated by each probe poses a problem.
Fluorescence spectra, like their complements, absorption and excitation spectra, are typically very broad – the signal occurs over many wavelengths. As a result, when a number of probes are being used simultaneously, signal from one probe can be detected in the spectral region of another probe. This problem is termed “crosstalk” (or “spillover” in flow cytometry). Figure 1 illustrates multiple fluorescent labels being excited with a single laser. It would be logical to reduce crosstalk by choosing fluorophores that are more spectrally separated, but this is not always an option, especially when using fluorescent proteins.

Figure 1. A number of fluorescent probes can be excited with a single laser (blue line).
In confocal microscopy, laser excitation light is raster scanned across the sample to induce the fluorescence signal. The fluorescence is collected by the objective lens and descanned through a pinhole to reduce signal from above and below the plane of interest. Standard confocal microscopes then direct the fluorescence signal through a series of optical filters (dichroic beamsplitters and band-pass filters) into single-element detectors (often PMTs) to read off the signal pixel-by-pixel. As seen in Figure 2, even with optimized band-pass filters, there is significant crosstalk between fluorescence signals. Using bandpass filters also greatly reduces the signal intensity of each fluorophore because out-of-band light is not detected.
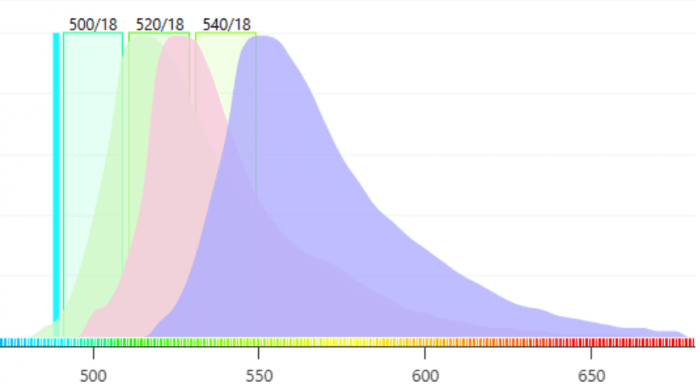
Figure 2. It is difficult to obtain “pure” signals from each fluorophore using optical bandpass filters.
To solve this problem, the first spectral confocal microscopes were released in the mid-2000s, starting with the Zeiss Meta and quickly followed by offerings from other major microscope companies. These systems have been improved over the years and use a variety of methods to create the spectra. Regardless of the method, all of the instruments can produce a full emission spectrum at each pixel. This spectrum is a sum of the emission from all of the contributing fluorophores in that pixel (Figure 3).
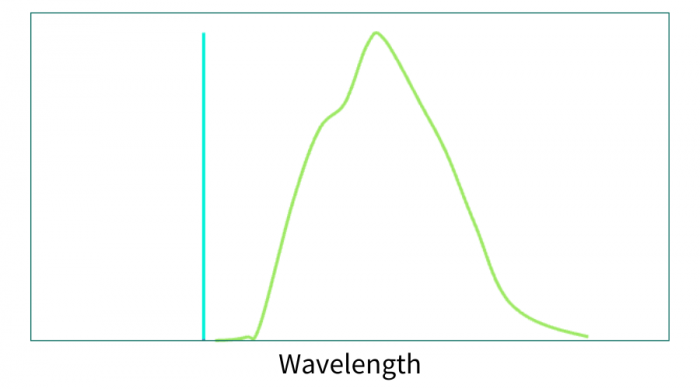
Figure 3. Example of a combined spectrum of the three spectra above.
Linear Spectral Unmixing
Data processing consists of linear spectral unmixing to determine the proportion of each fluorophore’s contribution to the spectrum. Reference spectra are required for the unmixing. These can be acquired individually (or in multi-labeled subsets) as control images, or in spectral libraries of common fluorophores provided by microscope manufacturers. Given the known spectra and the measured spectrum, one can calculate the contributions of each (Figure 4).
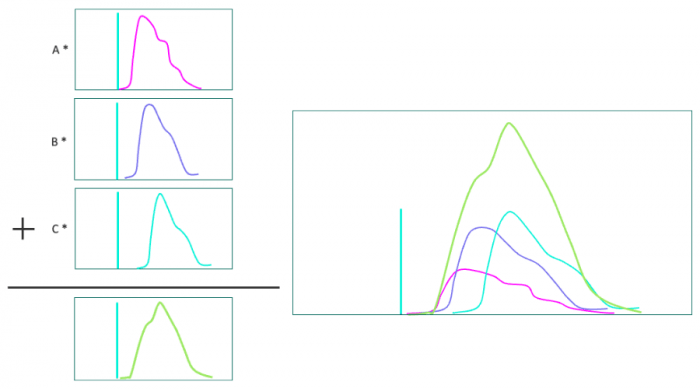
Figure 4. Left: Contributions of each spectrum (A,B,C) are calculated. Right: The three spectra with the proper coefficients combine to form the measured spectrum.
One advantage to Linear Spectral Unmixing is that it can be used to eliminate autofluorescence signal from the image. Autofluorescence spectra depend on the tissue type and can come from a variety of intrinsic fluorophores including NADH, FAD, chlorophyll, lipofuschin, retinals, melanin, etc. and can also arise as a fixation artifact. Commonly an autofluorescence spectrum of an unlabeled sample is acquired as one of the reference spectra. This contribution can then be hidden from the labeled image.
Linear Spectral Unmixing requires that there be at least one detection channel per fluorophore and that the fluorophore spectra are not identical.
The Hardware
There are many methods to resolve the spectral features of the fluorescence signal (figure 5). The original method, still widely used in microscopy and flow cytometry, involves a series of dichroic and bandpass filters and individual detectors for each wavelength band as described above. Given that the transmission (or reflectance) of a filter is typically about 95%, the signal strength degrades as it goes through the chain of dichroics and detectors. This limits the practical number of detectors to about 6. This limitation prompted microscope companies to come up with innovative spectral design solutions starting in the early-to-mid 2000s.
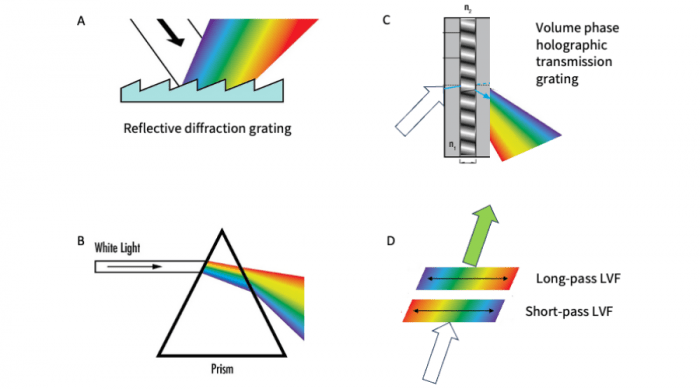
Figure 5. Different methods of producing spectral dispersion used in modern microscopes.
The initial approach by Zeiss in the 510 Meta instrument in the early 2000s was to employ a reflective diffraction grating and a linear detector array. Diffraction gratings use the interaction light with microscopic grooves on the surface to induce spectral separation (Figure 5a). The wavelength array (rainbow) is focused onto a linear array of photomultiplier tubes, enabling the simultaneous acquisition of all wavelength bands. This approach has been refined over the years, adding more optics for beam recycling, increasing the sensitivity and number of channels in the array (to 32) and by splitting off the low (near-UV) and high (NIR) wavelength edges of the spectrum to single-element detectors allowing them to be run at higher gain settings to account for sensitivity drop-off at these wavelengths. This “Quasar” detector assembly is the heart of the LSM980 and provides a spectrum from 380-720 nm with 34 total channels, with 10 nm spectral resolution. This design enables a fast, single-shot spectrum at each pixel. All channels are collected simultaneously without scanning or moving parts. This instrument has been used to image 10 fluorophores (9 fluorescent proteins and a calcium indicator) simultaneously in living mice.
Leica employs a prism to achieve spectral dispersion of the emission signal (Figure 5b). Prisms very efficiently separate colors by refraction. Over the years, Leica has refined the prism design and detector configurations. The Stellaris detector module, used in their latest confocal microscopes, uses 5 high efficiency detectors that enable scanning in the 410-850 nm range with adjustable resolution. Leica recently published a demonstration of unmixing a 15-plex fluorophore-labelled mouse tumor tissue sample.
Olympus (now Evident) uses a combination of dichroic filters and volume phase holographic transmission gratings (figure 5c) in their FluoView 3000 Lightpath confocal. Holographic gratings are made of a film of material with alternating refractive indexes (perpendicular to the surface) sandwiched between glass windows. The refractive index modulation in the film causes diffraction of the incoming beam into its spectral components. Their system design uses dichroic beamsplitters to split the spectral signals into various channels so different spectral regions can be scanned simultaneously with different resolutions and gain settings.
Nikon uses pairs of linear variable filters to enable custom bandpass configurations or wavelength scanning (figure 5d) in its DUX-VB detector module. Linear variable filters are optical filters where the spectral response changes linearly along the length of the filter. Using a combination of long-pass and short-pass filters, band-passes with custom widths and edge positions can be created. By simultaneously moving the short- and long-pass filters across the beam, wavelength scanning can be achieved in the 400-750 nm range, while simultaneously changing the spectral resolution if desired.
Supporting Your Research
As discussed, there are many clever approaches to achieving spectral separation, flexibility in resolution, speed and sensitivity in these systems. When combined with other methods like cyclical immunofluorescence techniques or fluorescence lifetime imaging, high-level multiplexing of scores of probes is becoming commonplace, unlocking a wealth of new information for the modern biologist.
FluoroFinder’s Microscopy Spectra Viewer and Panel Builder can help you visualize and select optimal fluorophore combinations and minimizing spectral crosstalk, ensuring cleaner and more reliable data. By streamlining the process of designing complex panels and offering comprehensive spectral data, FluoroFinder empowers scientists to maximize the potential of modern imaging systems and tackle the challenges of high-level multiplexing with confidence.
