For decades, traditional flow cytometry has been the dominant technique for analyzing single cells within large, heterogeneous populations. However, imaging flow cytometry (IFC) is rapidly becoming more mainstream due to the advantages that it can provide. We spoke with Rodrigo Pestana Lopes, Ph.D., Associate Director for Global Market Development at BD, Haley Pugsley, Ph.D., Senior Manager, Imaging and Spectral Applications at Cytek Biosciences, Inc., and Bill Anliker, Market Development Manager at Thermo Fisher Scientific, to learn how imaging flow cytometry is advancing scientific research and find out more about some of the instrumentation available.
Advantages of Imaging Flow Cytometry
“There are two main advantages of imaging flow cytometry compared to traditional flow cytometry,” explains Pugsley. “First, IFC provides spatial information on the location of the fluorescent signal within the cell. Traditional flow cytometry only captures the intensity of the fluorescent signal and does not provide specifics regarding the cellular location. Second, IFC enables the user to collect details about cell morphology. Determining the cell shape as well as the signal distribution is critical for many applications, including cellular function, drug responses, and cell behavior in different microenvironments.”
“Importantly, by combining the high throughput sampling of traditional flow cytometry with the image acquisition capabilities of microscopy, IFC is more powerful than either technique used in isolation,” adds Pestana Lopes. With IFC, image acquisition dramatically increases the measures available for each channel, such that more parameters can be incorporated into the gating strategy to define cell phenotypes. However, spectral compensation of high-resolution images is essential to confirm that the cell morphologies and locations of fluorescent signals are real and not an artifact of fluorescent crosstalk.
Imaging Flow Cytometry Applications
Although imaging flow cytometry can enhance any flow cytometry application by providing visual verification of cell health and staining, substantiated by statistical analysis, there are certain core applications where the technology really shines. These include measuring the nuclear location of signaling molecules, monitoring cellular uptake of particles, detecting co-localization of intracellular targets, and identifying changes in cell morphology. Additionally, IFC is well-suited to observe CAR T cell binding to target cells, as shown in Figure 1.
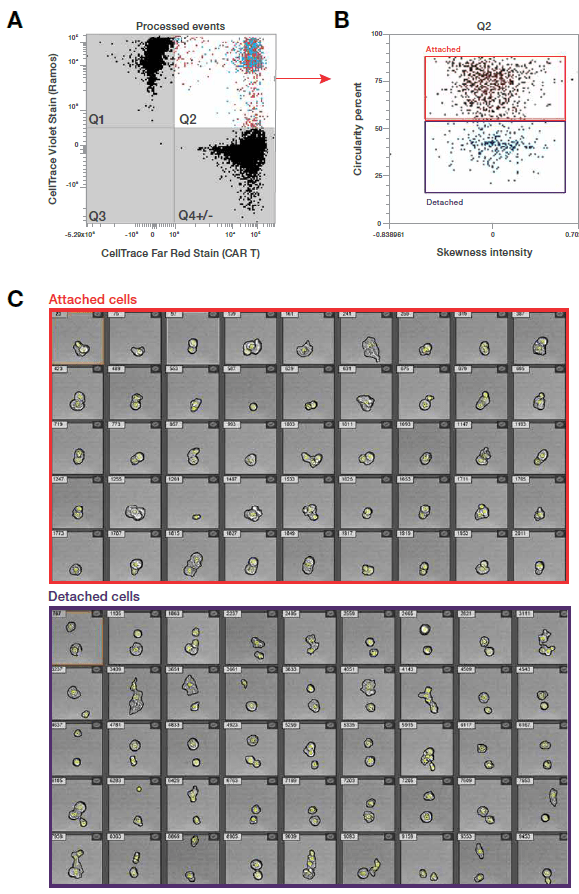
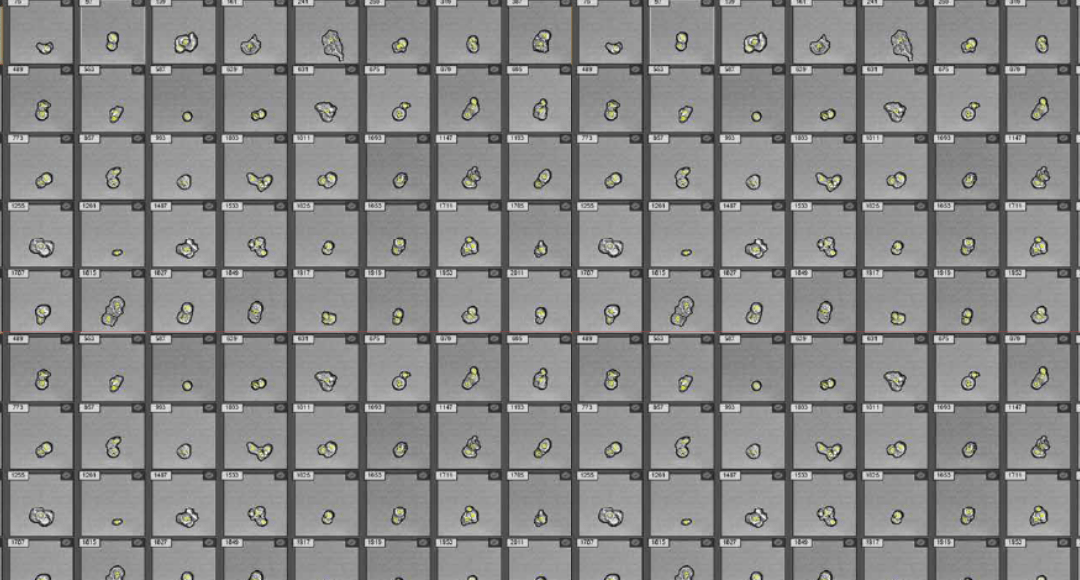
Figure 1. Visualization of CAR T cells targeting lymphoma cells. CAR T and Ramos cells were labeled with Invitrogen™ CellTrace™ Far Red and Violet stains, respectively, and incubated at a 1:1 ratio for 1 hour at 37°C. Unfiltered samples were acquired on the Attune™ CytPix™ Flow Cytometer at 200 μL/minute, >8 x 10⁵ cells/mL. (A) Quadrants Q1, Q4, and Q3 show individual Ramos cells, CAR T cells, and debris, respectively. Quadrant Q2 (positive for both stains) reveals both cell types fused together, acquired as a single event as the CAR T cells engulf the Ramos cells. Percentages are % gated. (B) Using circularity vs. skewness of intensity enables differentiation between attached cells (interactions between CAR T and Ramos cells) and detached cells (cells in the same field of view but not showing cell-to-cell interactions). (C) In the cell image galleries, annotated events are outlined in black with yellow dots indicating center positioning. Image processing was done using the “Cells Half Resolution” model. Data provided by Thermo Fisher Scientific.
There are also applications that simply can’t be performed with traditional flow cytometry and are instead dependent on IFC for their implementation. “An example is the measurement of T cell activation as a direct result of binding to an antigen-presenting cell,” reports Pugsley. “This application requires imaging to specifically detect a signal from an activation molecule, such as NF-kB in the nucleus of the T cell, while excluding the signal originating from the antigen-presenting cell.” Data showing NF-kB activation in T cells is presented in Figure 2.
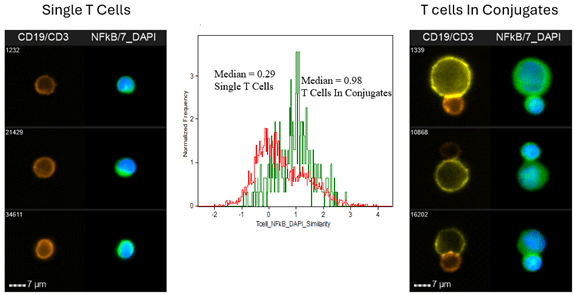
Figure 2. NF-kB Translocation In T-cell Conjugates When Attached To An Antigen-Presenting Cell. Raji B cells were loaded with Staphylococcal enterotoxin B to make antigen-presenting cells (APC). The APCs were incubated for 45 minutes with human T cells purified from peripheral blood. After incubation, the cells were fixed, permeabilized, and labeled with CD3 for T cells (orange), CD19 for APCs (yellow), DAPI for nuclei (blue), and anti-NF-kB (green). The Cytek® Amnis® ImageStream®X Mk II was used to collect 30,000 event image files at 60x magnification to assess the activation of NF-kB and its movement to the nucleus inside the T-cells when attached to an APC. The NF-kB activation was measured in the single T cells and compared to the T cells when connected to an APC (T cells in conjugates) using the “Similarity” feature that measures the similarity between the NF-kB image and the DAPI nuclear image. The median Similarity score for the T cells in conjugates has a higher similarity score, indicating more activation of NF-kB in the T cells when they are attached to an APC. This activation is also apparent when visually examining the images of the T-cells; in the single T cells there is a clear distinction between the blue DAPI signal and the green NF-kB signal, while the T cells in conjugates show a clear mixing of the blue DAPI and green NF-kB signals, showing that the NF-kB is activated. Note: Images are taken from the cells with the median similarity score. Data provided by Cytek Biosciences.
Challenges for Imaging Flow Cytometry
A major challenge for researchers performing IFC lies in handling the vast amounts of data that it generates. Although manual analysis is possible, it typically involves applying binary gates to a small number of selected features, which is both tedious and risks introducing user bias, as well as can lead to key information being missed. Fortunately, machine learning and artificial intelligence (AI) have driven huge advances within the field, enabling the use of sophisticated data analysis algorithms to obtain reproducible and statistically significant results. Further hurdles can be encountered when learning how to run IFC instrumentation and software, although most imaging flow cytometry systems are designed with ease-of-use in mind.
Imaging Flow Cytometry Instrumentation
The first imaging flow cytometer to reach the market was the ImageStream® platform, introduced by Amnis Corporation in 2004. Following acquisitions by Merck (2011) and Luminex (2018), the ImageStream is now fully owned by Cytek Biosciences and has evolved into the Cytek® Amnis® ImageStream®X Mk II imaging flow cytometer.
Cytek® Amnis® ImageStream®X Mk II Imaging Flow Cytometer
The Cytek® Amnis® ImageStream®X Mk II imaging flow cytometer delivers multiple high-resolution images of every cell in flow, including brightfield, darkfield (SSC), and as many as ten fluorescent markers at rates of up to 5,000 objects per second. Images are spectrally compensated on a pixel-by-pixel basis, ensuring all observed morphology is from the expected fluorochrome. The system can be equipped with up to six excitation lasers and offers magnifications of 60X/40X/20X with a pixel size of 0.3/0.5/1.0 μm, respectively, allowing for visualization of fluorescence signals from the cellular membrane, cytoplasm, subcellular organelles, and nucleus. Other key features include automated startup, calibration, and cleaning scripts using onboard sheath fluid, water, and cleaning solutions. In addition, the design of the Cytek Amnis ImageStreamX Mk II imaging flow cytometer increases signal and minimizes noise to provide exceptional photonic sensitivity for small particle detection and high image quality.
In terms of data analysis, the powerful and intuitive IDEAS® image analysis software allows entry level users to simply press the “Start Analysis” button and be guided through the automated process with a wizard that analyzes the data for core applications like apoptosis, cell cycle, co-localization, internalization, nuclear localization, shape change, and spot counting. More advanced users can create custom analyses using the 86 core features and 22 function masks to devise a strategy that fits their experiment. The option also exists to generate a novel combined feature using the machine learning module for IDEAS® software and/or employ the Amnis® AI software option for deep learning using convolutional neural network or random forest algorithms to characterize each cell population in the sample.
Invitrogen™ Attune™ CytPix™ Flow Cytometer
The Invitrogen™ Attune™ CytPix™ Flow Cytometer combines acoustic focusing with a high-speed brightfield camera for simultaneous high throughput flow cytometry and high resolution brightfield imaging. Images are captured at a rate of up to 6,000 images per second, depending on the flow rate and image size, and can be viewed in real time to confirm sample quality, optimize protocols, and record the morphology of each cell population identified for analysis.
With the Invitrogen Attune CytPix Flow Cytometer, researchers can quickly and easily highlight structural features of large populations. In parallel, AI-driven automated image analysis software uses trained image processing models to translate event features into distinct morphology parameters, enhancing the gating strategy by including cells of interest while excluding aggregates, unwanted cells, and debris. Commonly utilized parameters include cell count (Particle Count), which allows for confirmation of singlets, as well as roundness (Circularity), size (Area Square), shape (Eccentricity) and complexity (Entropy). These measures are readily combined with standard fluorescence and scatter parameters to reveal highly reproducible population changes and unique subsets.
Notably, the Invitrogen Attune CytPix Flow Cytometer has an interactive retraining feature that lets users refine the vendor-supplied AI models to reflect their subject matter expertise. This contributes to improved analytical accuracy for a broad range of sample types and applications.
BD CellView™ Image Technology: Real-Time Imaging in Spectral Flow Cytometry
BD CellView™ Image Technology, which is integrated into both the BD FACSDiscover™ A8 Cell Analyzer and the BD FACSDiscover™ S8 Cell Sorter, introduces real-time imaging to spectral flow cytometry through a camera-free system capable of acquiring over 10,000 events per second. Using Orthogonal Frequency Domain Multiplexing (OFDM), it reconstructs high-resolution 2D images that are comparable to 10–20x magnification in widefield microscopy. This is achieved by splitting a 488 nm laser into 104 frequency-tagged sub-beams and decoding the signal through dedicated photodetectors for axial light loss (ALL), forward and side scatter (FSC and SSC), and three fluorescence channels (534/46, 600/60, and 788/225).
BD CellView™ supports both label-free and fluorescent applications, generating over 70 image-derived parameters per cell, including size, signal intensity, diffusivity, eccentricity, radial moment, and delta center of mass. On the A8 Analyzer, these spatial and morphological parameters are combined with full-spectrum fluorescence data to enhance single-cell analysis. The S8 Sorter extends this capability by enabling sorting based on both spectral and real-time image-derived parameters, allowing for the isolation of rare or morphologically distinct populations as fast as needed for high-speed sorting decisions.
Together with BD SpectralFX™ Technology—which provides full-spectrum detection and system-aware unmixing for complex panels—the BD FACSDiscover™ platforms offer a unique integration of analytical depth, spatial resolution, and real-time decision-making. This combination expands the scope of flow cytometry, bridging the gap between high-dimensional analysis and imaging.
Flow cytometric image-based cell cycle analysis and sorting using the S8 equipped with BD CellView Image Technology is shown in Figure 3.
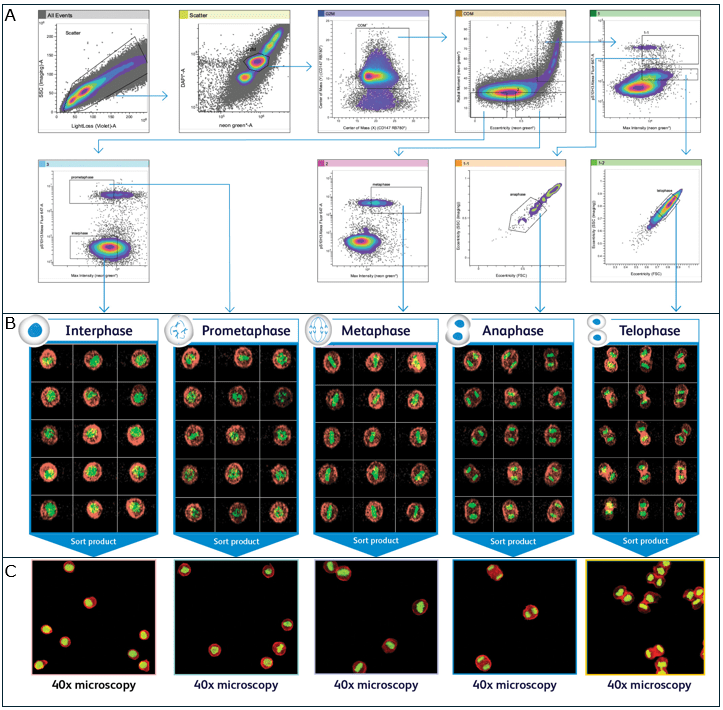
Figure 3. Flow Cytometric Image-Based Cell Cycle Analysis and Sorting. HeLa cells expressing mNeonGreen-tagged histone H2B were synchronized to enrich rare mitotic stages and released into mitosis without chemical perturbation. Cells were fixed and labeled with antibodies against phosphorylated histone H3 at serine 10 (pS10H3-AF647), a marker of chromatin condensation, and CD147 (RB780), a broadly expressed surface protein for membrane identification. DNA content was counterstained with DAPI for univariate cell cycle analysis. Samples were analyzed and sorted using the BD FACSDiscover™ S8 Cell Sorter equipped with BD CellView™ Image Technology. (A) The integration of conventional flow cytometry parameters (Blue and Violet scatter, DAPI, mNeonGreen, AF647, and RB780) with image-derived metrics (Blue scatter, Center of Mass, Radial Moment, and Eccentricity) enables a multidimensional assessment of DNA content and chromatin architecture for precise cell cycle phase discrimination. The gating strategy delineates mitotic subpopulations within the G2/M compartment (identified by DAPI and H2B intensity) and leverages morphological cues such as the elongated cell shape characteristic of Anaphase and Telophase, the linear chromosome alignment in Metaphase, and the nuclear circularity observed in Interphase and Prometaphase. (B) Representative real-time images captured within each gate confirm the presence of all five major mitotic stages using BD CellView™ Image Technology, validating the gating strategy. Fluorescent signals are shown as green for histone H2B (mNeonGreen) and red for CD147 (RB780), enabling simultaneous visualization of chromatin organization and cell membrane structure. (C) The validated gating strategy was applied to sort cells corresponding to each mitotic phase onto microscope slides. Sorted cells were subsequently imaged using a 40× fluorescence-enabled microscope to confirm phase identity and validate sort purity. Data provided by BD Biosciences.
Supporting Your Research
FluoroFinder has developed a suite of tools that can help you design your next imaging flow cytometry experiment. Use our Antibody Search function to find antibodies that are validated for flow cytometry, then check the optical properties and spectral profiles of more than a thousand fluorochromes in our Fluorescent Dye Database. To identify dyes that are compatible with your IFC platform, use our Spectra Viewer.


