Guest Authored By: Vera Tang, Ph.D.
Interest in the study of extracellular vesicles has increased exponentially over the past two decades due to the important role they play in inter-cellular communication, as biomarkers of disease, and vehicles for drug delivery.
What are Extracellular Vesicles and Why Study Them?
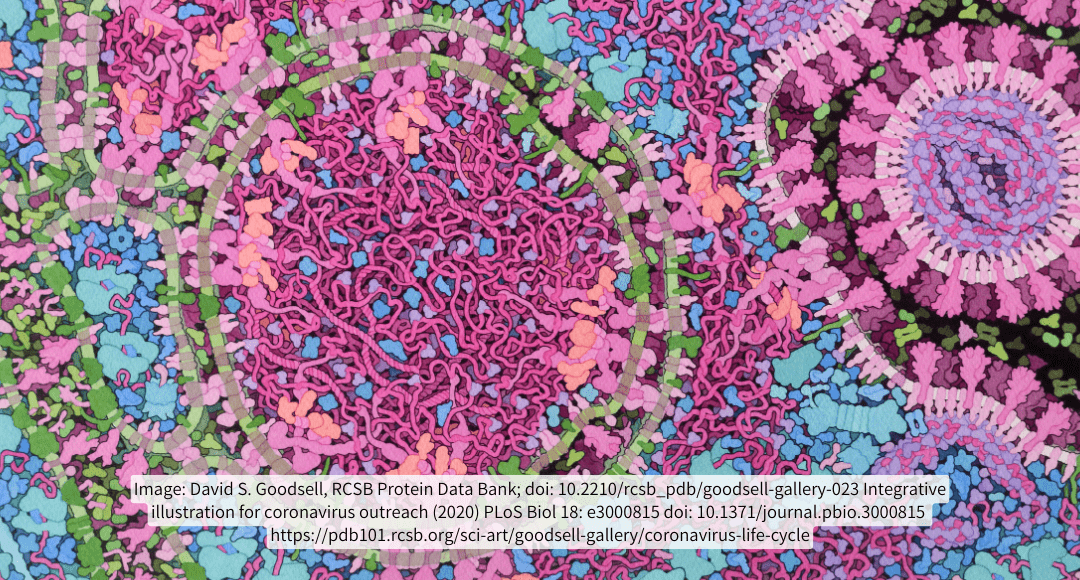
Extracellular Vesicles (EVs) span a large range of sizes from about 20-30 nm to several microns, consisting of many types of particles produced through various biological processes. The generic term of “extracellular vesicles” was adopted in 2014, by the International Society for Extracellular Vesicles (ISEV) as “encompassing all cell-released, membranous particles” in the Minimum Information for Studies of Extracellular Vesicles (MISEV) guidelines1. In 2018, this definition was appended to include “particles naturally released from the cell that are delimited by a lipid bilayer and cannot replicate”2. In 2023, the word “naturally” was removed from the definition3. Terms identifying different types of vesicles such as exosomes, microvesicles, and apoptotic bodies, were more commonly used prior to the adoption of the generic term of EV. These terms are still used when the specific biogenesis mechanisms of the particles of interest are explicitly demonstrated. Size alone does not identify the type of EV. It is also worth noting that, in certain interpretations, the definition of EV could potentially include some viruses.
Why are EVs Challenging to Study?
Simply put, EVs are very small. This makes it challenging to detect them using commonly available lab equipment such as flow cytometers and light microscopes because most EVs are at or below the limit of detection of many of these technologies. The small size of these particles inherently means there is limited surface area to express proteins (e.g. CD markers) and internal volume to hold relevant cargo (e.g. mRNA); common targets for EV phenotypic studies. EVs can be expected to have very few surface proteins and internal cargo for detection in comparison to cells. Theoretically, a 10 µm cell is 100 times larger than a 100 nm EV in diameter but has 10,000 times the surface area and 1,000,000 times the volume. To give an example, a typical human CD4 T cell expresses approximately , 50,000 to 150,000 molecules of CD4 on its surface4,5. If we assume the antigen density of CD4 is the same on the EVs as that of the T cells producing them, the number of CD4 molecules on an EV that is 100 times smaller than the cell (in diameter) will be in the order of 5-15 molecules.
EV samples can be heterogeneous depending on the source. EVs isolated from liquid biopsies, such as blood and urine, may contain many different types of EVs as well as proteins and endogenous viruses. Viruses and virus-like particles can also share many of the same markers used to identify EVs6 and similar structural components and physical characteristics such as lipid membranes and buoyant densities7. In contrast, EVs isolated from cell lines in vitro are more homogenous as they are derived from a single cell type. Generally, phenotypic characterization of EVs benefits from utilizing single-particle detection technologies and not bulk analyses because biological variation exists even in the simplest of samples. Single-particle detection technologies, such as flow cytometry, analyze individual particles in the sample. Bulk analysis techniques, such as western blotting, provide an average measurement of all the particles combined, masking any heterogeneity within a sample. Nonetheless, western blotting consistently remains the most used method for analysis of EVs in world-wide surveys conducted by ISEV with only ~50% of respondents choosing flow cytometry as a technique utilized in their lab8,9.
Flow Cytometry as a Tool to Study EVs
Flow cytometry is a technology designed to provide information on both the fluorescence and size of individual particles, namely cells, with a high degree of sensitivity. The high-throughput and single-particle basis of detection has made flow cytometry the go-to method for characterizing heterogeneous cellular populations with numerous parameters spanning multiple decades in fluorescence intensity signals. Nevertheless, EVs can be challenging to analyze, requiring additional controls and alternate approaches to analysis than those used for cells.
Most Flow Cytometers are Designed to Analyze Cells, Not EVs
Coincidence
The sample core stream of most flow cytometers will be much wider than the diameter of EVs. This significantly increases the occurrence for coincidence measurements, which is the simultaneous detection of multiple particles as a single event. Specific controls and procedures are recommended in the Minimum Information about a Flow Cytometry experiment on EVs (MIFlowCyt-EV) reporting framework to verify that single particle measurements are being made10.
Settings Optimization
The detection of EVs requires the use of flow cytometers at the limit of detection. This means that the standard settings used for detection of cells will not adequately resolve EVs and other small particles. The manufacturer’s instrument quality control software to monitor performance was not designed with the intention of using the instruments at the limit of detection (LoD). There is yet to be a consensus method to detect EVs or to optimize instrument settings for small particle detection, although a workflow was proposed by Cook et al. in 202311, detailing a method for instrument detector settings optimization and data calibration for standardized reporting.
Standardization of Data Reporting
Flow cytometers collect data in the form of light intensity. These measurements are arbitrary and lack standard units for direct comparisons between different instruments and timepoints. To make quantitative comparisons, flow cytometry data requires the use of controls, calibration materials and software. Methods to calibrate fluorescence12 and light scatter13 data from cell samples into standard units have existed since the 1980’s. These methods have been demonstrated in small particle samples in the recent two decades14–16.
Data reporting in standard units is especially important for analysis of EVs and other small particles because these particles of interest are at or below the instrument limit of detection. Importantly, this limit of detection will also differ between instruments, irrespective of manufacturer and model. In a recent cross-platform comparative study with four Cytoflex S and four Aurora ESP analyzers utilizing the same method of settings optimization, the LODs for these flow cytometers ranged from 29 to 155 EGFP MESF and light scatter sensitivity from 72 to 100 nm for detection of a recombinant GFP+EV reference sample11ix. Other studies comparing a wider range of flow cytometers have reported even greater variability in detection sensitivity for light scatter15,17. Differences in LoD directly impact the number of EVs detected in an exponential manner18,19 and have implications on the statistics that should be reported for EV flow data.
The percentage of cells positive for specific markers is a commonly reported statistic in flow cytometry. Unfortunately, this same statistic does not hold similar merit in EV flow cytometry data because, as discussed above, not all EVs are resolved and the amount of EVs detected varies with the LoD of the instrument. Reporting the concentration of EVs expressing a marker of interest within a certain size and intensity of expression (in standard units) is a reproducible way to report statistics associated with EVs outlined in the MIFlowCyt-EV Reporting Framework10.
Reagents
Most commercially available flow cytometry reagents are designed for applications in cellular detection assay and are not validated for use in EVs. In the case of fluorescent dyes and conjugated antibodies, aggregates of these reagents can be misidentified as labeled EVs if the appropriate controls are not used. In many cases, washing of EV samples by centrifugation is not feasible and so titration of reagents becomes crucial to optimization of sample labeling from background. Many commercial fluorescently conjugated antibodies are sold in “tests” and do not readily disclose the concentration. This makes it very challenging to standardize and compare between reagent lots.
In consideration of these many challenges to analyze EVs by flow cytometry, the small particle/EV flow cytometry community has produced numerous educational resources and frameworks to support researchers in these studies. For those new to the field, the following provide some important background information to get you started:
- A compendium of single extracellular vesicle flow cytometry20
- MIFlowCyt-EV: a framework for standardized reporting of extracellular vesicle flow cytometry experiments10
- The most recent MISEV update3
What’s Next on the Horizon?
Hardware
We are seeing an increase in commercially available flow cytometers that are dedicated to small particle detection and while this may not be for every budget, add-ons for more sensitive light-scatter detection are now available on analyzers from most major flow cytometry vendors. Dedicated small particle flow cytometers are now capable of resolving 40 nm polystyrene beads from noise by light scatter (CytoFLEX Nano, NanoFCM). Increasing sensitivity in fluorescence detection for single molecule resolution will be the new frontier as this will be required for the phenotypic characterization of the smallest detectable EVs.
Software
As the analysis of EVs and other small particles like viruses become more common, instrument manufacturers need to incorporate more detailed quality control (QC) measures to monitor performance as well as instrument service to support these types of assays. Especially with respect to dedicated small particle flow cytometers, incorporating well characterized reference materials into more detailed QC procedures will give more quantitative metrics to monitor instrument performance. Software for data calibration such as FCMPASS21 and Rosetta Calibration22 are currently separate from acquisition. Beckam Coulter currently provides FCMPASS software with the purchase of the CytoFLEX Nano23 and Rosetta Calibration is available as a plug-in for FlowJo24. However, to facilitate wider adoption of standardized data reporting, calibration should be incorporated in the acquisition software such that raw data from a flow cytometer can be exported in standard units.
Reagents
With respect to antibodies, having more information on specific antibody lots including the concentration and fluorophore to protein ratios and better removal of aggregates would be beneficial for both cell and EV based assays. Vendors such as Biolegend have taken the lead and implemented a searchable database of their Certificates of Analysis by lot number25. In terms of reference materials for calibration, more high quality, well characterized materials are needed such as the 3000-series Nanosphere Size Standards26 from ThermoFisher which are NIST-traceable and come with a certificate of analysis. A similar need exists for well characterized materials for fluorescence calibration that can work across different detection platforms.
Supporting Your Research
We are at an exciting time for flow cytometry with spectral, imaging, and an ever-growing list of new technologies with improved sensitivity coming to the forefront. Perhaps in the not-so-distant future, the analysis of EVs and other nanometer-sized particles by flow cytometry will be standard procedure and automated software workflows with facilitate reporting in standard units making this a reality for both cell and EV data alike.
For researchers wanting to study EVs using flow cytometry, FluoroFinder has tools designed to support both beginners and experts. Our platform includes thousands of validated reagents. Use the Spectra Viewer to help you select fluorochromes compatible with your instrument’s sensitivity and filters—essential for working at the limits of detection. FluoroFinder also connects you with reference materials, calibration tools, and educational resources that align with MIFlowCyt-EV and MISEV guidelines, empowering you to design reproducible experiments and confidently report results in standardized units. Whether you’re optimizing for rare marker detection or comparing cross-platform data, FluoroFinder helps you stay ahead in this rapidly evolving field.
References:
- Lötvall, J. et al. Minimal experimental requirements for definition of extracellular vesicles and their functions: a position statement from the International Society for Extracellular Vesicles. J. Extracell. Vesicles 3, 26913 (2014).
- Théry, C. et al. Minimal information for studies of extracellular vesicles 2018 (MISEV2018): a position statement of the International Society for Extracellular Vesicles and update of the MISEV2014 guidelines. J. Extracell. Vesicles 7, 1535750 (2018).
- Welsh, J. A. et al. Minimal information for studies of extracellular vesicles (MISEV2023): From basic to advanced approaches. J. Extracell. Vesicles 13, e12404 (2024).
- Wang, L. et al. Variables in the quantification of CD4 in normals and hairy cell leukemia patients. Cytometry B Clin. Cytom. 80B, 51–56 (2011).
- Wang, M. et al. Quantifying CD4 receptor protein in two human CD4+ lymphocyte preparations for quantitative flow cytometry. Clin. Proteomics 11, 43 (2014).
- Burnie, J. et al. Identification of CD38, CD97, and CD278 on the HIV surface using a novel flow virometry screening assay. Sci. Rep. 13, 23025 (2023).
- Nolte-‘t Hoen, E., Cremer, T., Gallo, R. C. & Margolis, L. B. Extracellular vesicles and viruses: Are they close relatives? Proc. Natl. Acad. Sci. 113, 9155–9161 (2016).
- Gardiner, C. et al. Techniques used for the isolation and characterization of extracellular vesicles: results of a worldwide survey. J. Extracell. Vesicles 5, 32945 (2016).
- Royo, F., Théry, C., Falcón-Pérez, J. M., Nieuwland, R. & Witwer, K. W. Methods for Separation and Characterization of Extracellular Vesicles: Results of a Worldwide Survey Performed by the ISEV Rigor and Standardization Subcommittee. Cells 9, 1955 (2020).
- Royo, F., Théry, C., Falcón-Pérez, J. M., Nieuwland, R. & Witwer, K. W. Methods for Separation and Characterization of Extracellular Vesicles: Results of a Worldwide Survey Performed by the ISEV Rigor and Standardization Subcommittee. Cells 9, 1955 (2020).
- Cook, S., Tang, V. A., Lannigan, J., Jones, J. C. & Welsh, J. A. Quantitative flow cytometry enables end-to-end optimization of cross-platform extracellular vesicle studies. Cell Rep. Methods 3, 100664 (2023).
- Brown, M. C., Hoffman, R. A. & Kirchanski, S. J. Controls for Flow Cytometers in Hematology and Cellular Immunology. Ann. N. Y. Acad. Sci. 468, 93–103 (1986).
- Doornbos, R. M. P. et al. Lissajous‐like patterns in scatter plots of calibration beads. Cytometry 16, 236–242 (1994).
- Welsh, J. A., Jones, J. C. & Tang, V. A. Fluorescence and Light Scatter Calibration Allow Comparisons of Small Particle Data in Standard Units across Different Flow Cytometry Platforms and Detector Settings. Cytometry A 97, 592–601 (2020).
- Van Der Pol, E. et al. Standardization of extracellular vesicle measurements by flow cytometry through vesicle diameter approximation. J. Thromb. Haemost. 16, 1236–1245 (2018).
- Stoner, S. A. et al. High sensitivity flow cytometry of membrane vesicles. Cytometry A 89, 196–206 (2016).
- Standardisation of concentration measurements of extracellular vesicles for medical diagnoses – METVES II. https://www.metves.eu/.
- Gasecka, A., Böing, A. N., Filipiak, K. J. & Nieuwland, R. Platelet extracellular vesicles as biomarkers for arterial thrombosis. Platelets 28, 228–234 (2017).
- Cimorelli, M., Nieuwland, R., Varga, Z. & Van Der Pol, E. Standardized procedure to measure the size distribution of extracellular vesicles together with other particles in biofluids with microfluidic resistive pulse sensing. PLOS ONE 16, e0249603 (2021).
- Welsh, J. A. et al. A compendium of single extracellular vesicle flow cytometry. J. Extracell. Vesicles 12, e12299 (2023).
- FCMPASS. https://www.fcmpass.com/.
- Rosetta Calibration – Exometry. https://www.exometry.com/products/rosetta-calibration/.
- Optimizing EV Analysis with a CytoFLEX nano flow cytometer and FCMPASS. https://www.beckman.com/resources/reading-material/application-notes/optimizing-ev-analysis-with-a-cytoflex-nano-flow-cytometer-and-fcmpass.
- Rosetta Calibration. FlowJo Documentation https://docs.flowjo.com/flowjo/plugins-2/plugin-demonstration-videos/rosetta-calibration/.
- Certificate of Analysis. https://www.biolegend.com/de-de/certificate-of-analysis.
- 3000 Series NanosphereTM Size Standards. https://www.thermofisher.com/order/catalog/product/3020A.


