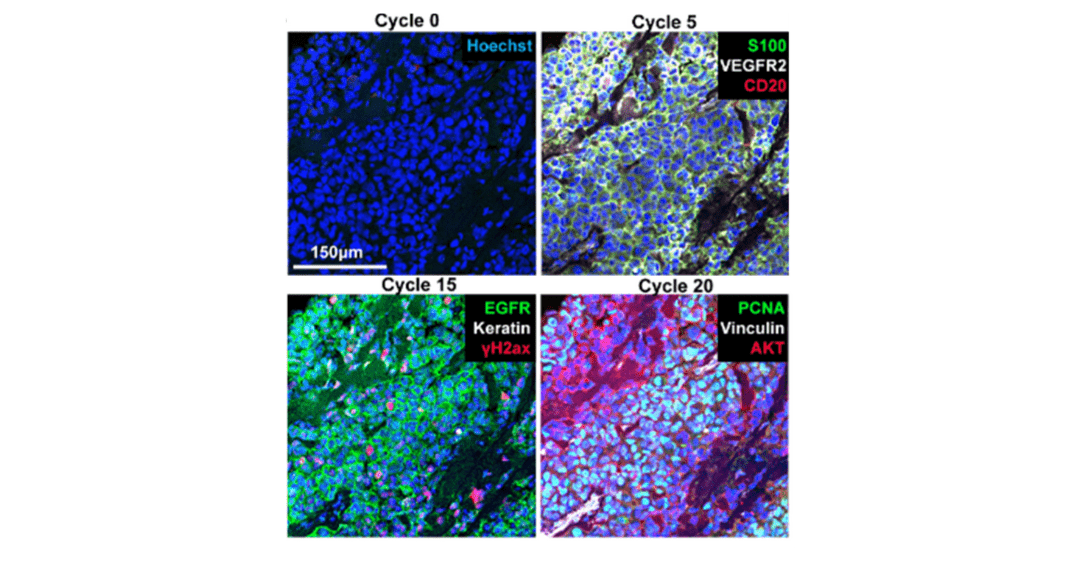
Cover Image: Selected images of a melanoma specimen subjected to 20 cycles of Cyclic IF after cycles 0, 5, 15 and 20. Used without modification under Creative Commons Attribution 4.0 International License from (Lin, 2018) Figure 4G.
Spatial biology aims to characterize cells and molecules in their natural 3-dimensional environment to answer questions about cellular and molecular interactions. Techniques like cyclic immunofluorescence allows the clinician or researcher to label hundreds of proteins in a single sample, providing new insights into tumor microenvironments, drug/tissue interactions and neuroscience. By labeling a few antigens at a time, the researcher is not limited by fluorescence spectral overlap, but can image, elute, inactivate or bleach the fluorescent labels and relabel different antigens in multiple cycles. Originally, (Nash, 1969) this technique required a great deal of time in manual pipetting, validation, image registration and analysis as well as large quantities of antibodies and other reagents. Because of the manual labor involved, it didn’t really take off until expensive robotic pipetting and washing systems (e.g. Tecan’s Genesis, Zymark’s Pi system, Biotek’s Precision) became available starting in the late 1980s. Robotics made liquid handling easier, but this didn’t change the large reagent volumes required, and researchers still had the difficult task of manual image acquisition and registration between each labeling cycle.
Modern instruments like Miltenyi Biotec’s MACSima integrate robotic pipetting methods with an imaging system (Table 1). The sample stays within the motorized instrument, which together with sophisticated data processing software, eliminates the need for manual image registration. Samples are loaded into microplates, or larger sample wells attached to glass slides (MACSwell™ imaging frames), and imaging occurs through the bottom of the well. A peristaltic pump is used for large volume washes, while a syringe pump dispenses small volumes of up to 300 different reagents in a single experiment. (Kinkhabwala, 2022) While small volumes (< 50 mL) can be used in 96-well plates, error in the dispensed volume becomes significant (5-10%), and evaporation can occur in the open wells during incubation steps. In addition, pipetting typically does not completely evacuate each well, so several wash steps are needed to fully replace each solution and allow diffusion into the sample. This adds time and volume to the process.
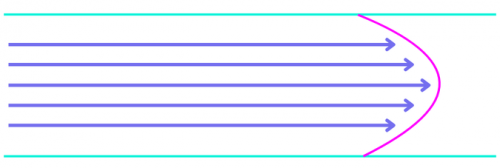

Figure 1. Laminar versus turbulent flow. In viscous laminar flow (top), the liquid moves through the chamber in a straight line along the direction of flow, with diffusion occurring in other directions. The fluid front is represented by the blue line. In turbulent flow (bottom), the liquid becomes mixed as it flows through the chamber and there is no fluid front, but a gradient between liquids.
To address these limitations, some companies have integrated optically transparent microfluidics into their instruments (Table 1). The microfluidic chambers are designed to balance viscous forces, capillary forces and wetting to achieve desired flow properties. Good wetting and strong capillary forces increase solution velocity at the edges of the chamber while viscous forces lead to higher velocities in the middle. Designers carefully choose materials and cell geometries to balance these forces to generate laminar flow (Figure 1), while multiple inlet and outlet streams or baffles help equalize the velocity between the edges and the middle of the chamber creating a straight fluid front (Figure 2). Optimizing the chamber design results in very efficient reagent changes (< 1 s) and a speedier immunolabelling process.
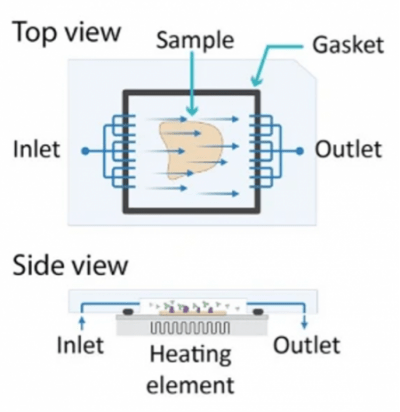
Figure 2. Schematic of a microfluidic cell that uses multiple inlet and outlet streams to flatten the fluid front. Lunaphore also includes a Peltier heater for temperature control. Used without modification under Creative Commons Attribution 4.0 International License from (Rivest, 2023) Figure 1c.
Of course, the presence of tissue samples in the chamber fundamentally changes the overall flow properties. Most of these chambers are designed to be used with sections ~10 mm thick, or cells immobilized by silylization or other methods to maintain efficient solution exchange above the sample. The microfluidics are affixed to the top of the microscope slide with pressure-sensitive adhesive, forming the chamber and encapsulating the samples. Reagent exchanges can occur while in the imaging position, or the chambers can be cycled in and out of the optical path with precision motors to increase throughput (COMETTM). Imaging is performed through the top surface. A large imaging area (Table 1) enables characterization of large tissue slices, increasing the likelihood of capturing rare phenotypes. Larger area chambers can also hold several smaller slices or microarrays to be processed and analyzed together, saving reagents and time.
Table 1. Comparison of Cyclic IF systems.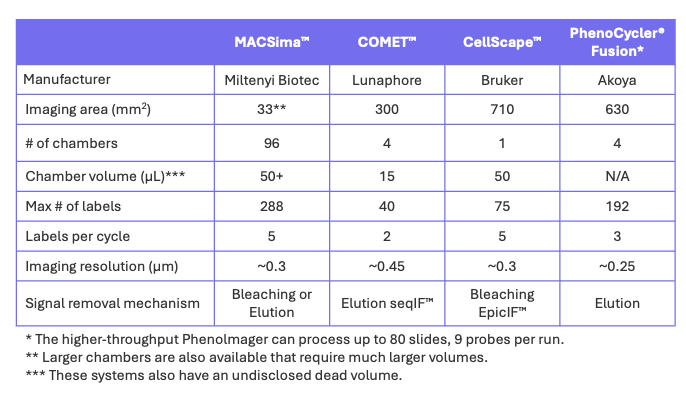
Each company sells antibody panels and reagents validated to work with their systems. Lunaphore’s SPYRETM panels and Bruker’s VistaPlexTM kits can be expanded with antibodies from the customer’s own library. Akoya’s PhenoCycler®-Fusion is designed to work with oligonucleotide barcode-conjugated antibodies. They offer the PhenoCodeTM Discovery Panel and conjugation reagents for customized antibodies with fluorescently tagged complementary oligo “reporters”. Miltenyi Biotec sells validated antibodies and kits, but with the ability to perform both bleaching and elution protocols, MACSimaTM can easily adapt to other antibody reagents as well.
Although the maximum number of labels per experiment varies widely (Table 1), given the sophisticated image processing software and precision motors in each instrument, it is simple to rerun the same sample with additional reagents. Indeed, samples can be stored in microfluidic chambers for additional labeling experiments at a later time. The number of labels per cycle is determined by the light sources and filters installed, which in turn dictate which fluorophores can be used in each system. The imaging systems are all integrated with mapping, tiling, focusing, registration and correction (e.g. flat field) capabilities to image the entire sample area after each labelling cycle, giving the user a truly automated experience. Image analysis software performs cell segmentation, pseudocolor display and scatter plots similar to those seen in flow cytometry for population studies.
Robotics, microfluidics and precision motors have transformed the spatial biology toolbox. Weeks of work is finished within a single day without intervention, allowing researchers to focus on the science instead of the protocol. These truly automated systems have enabled advances in personalized medicine, drug discovery and oncology that were impossible a decade ago.
Supporting Your Research
The complexity of designing and executing Cyclic Immunofluorescence (Cyclic IF) presents researchers with a host of new challenges, from washing difficulties and the varying efficacy of reagents, to proper planning and execution of the various imaging and antibody release/photobleaching rounds.
FluoroFinder has developed a suite of tools to help streamline your Cyclic IF experiments. Use our Cell Types Tool to identify target antigens on your cell type of interest, then head over to our Antibody Search function to find antibodies validated for immunofluorescence, or our Fluorescent Dye Directory to research reagents compatible with your microscopy setup. To further support Cyclic IF and Microscopy experiments, FluoroFinder is developing:
- The Cyclic Immunofluorescent Panel Builder – a tool designed to identify appropriate reagents for your experiment, optimize immunofluorescence rounds, and track the iterative process of designing Cyclic IF panels
- Microscopy Spectra Viewer – configure your microscope and leverage the Microscopy version of our Spectra Viewer to select the best dyes for your setup
If you or a colleague is interested in contributing towards the development of these tools with ideas, beta testing, or feedback, please contact support@fluorofinder.com.
References:
- Kinkhabwala (2022) doi:10.1038/s41598-022-05841-4
- Lin (2018) doi:10.7554/eLife.31657
- Nash (1969) https://www.ncbi.nlm.nih.gov/pubmed/4182369
- Rivest (2023) doi:10.1038/s41598-023-43435-w


